Category: Tool

Using Twine for non-linear tutorials

Dozens of steps in a map
Bird’s eye view of my ebooks tutorial

I was first introduced to Twine through Birdland, a delightfully weird bit of e-lit. Its engine, Twine, is designed specially for interactive, nonlinear stories (the choose-your-own-adventure kind).

Turns out Twine is useful for non-literary purposes, too. For some tutorials, it doesn’t make sense to use a linear structure, so Twine is a great tool. Examples of library-related Twine tutorials: choosing a reference manager or how to use the library.

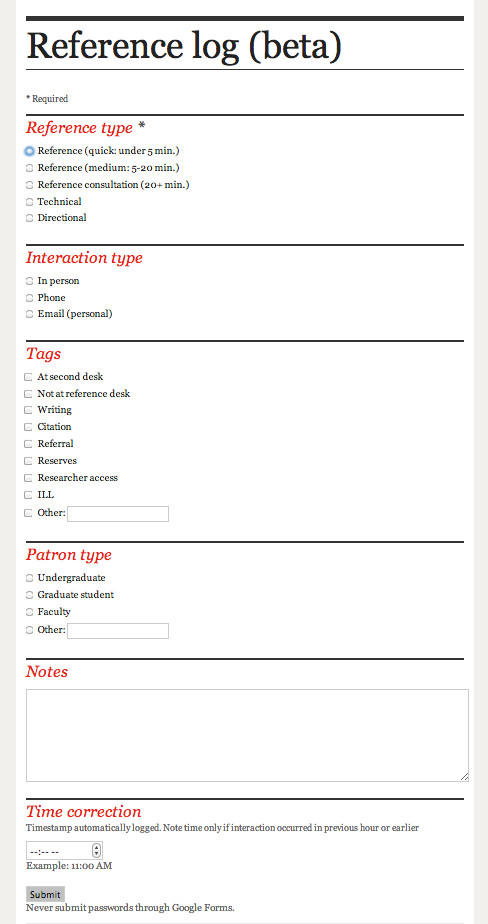
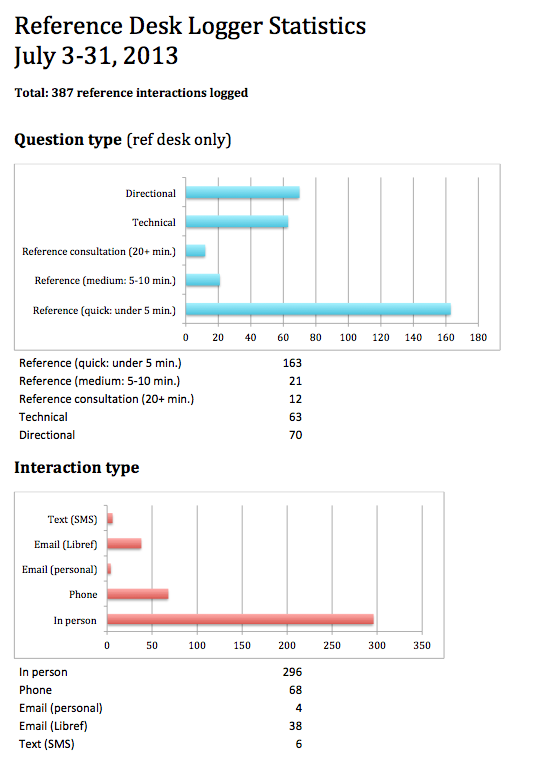
In the library where I work, we get a lot of questions about using ebooks. These questions often come by phone, email, or chat. Patrons are (rightly) frustrated about the overly complicated process to download ebooks. On the phone, reference help usually begins with something like, “Are you seeing the word ‘Ebsco’ in the upper left-hand corner?” But patrons shouldn’t have to learn all about our ebook vendors just to do their reading! Even librarians feel a headache coming on trying to diagnose ebook problems and remember which vendors require an Adobe ID login (ugh). So…

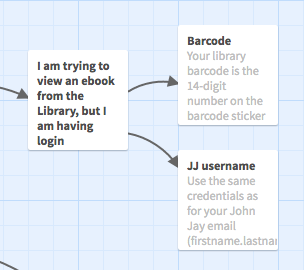
Enter a Twine tutorial about using ebooks!

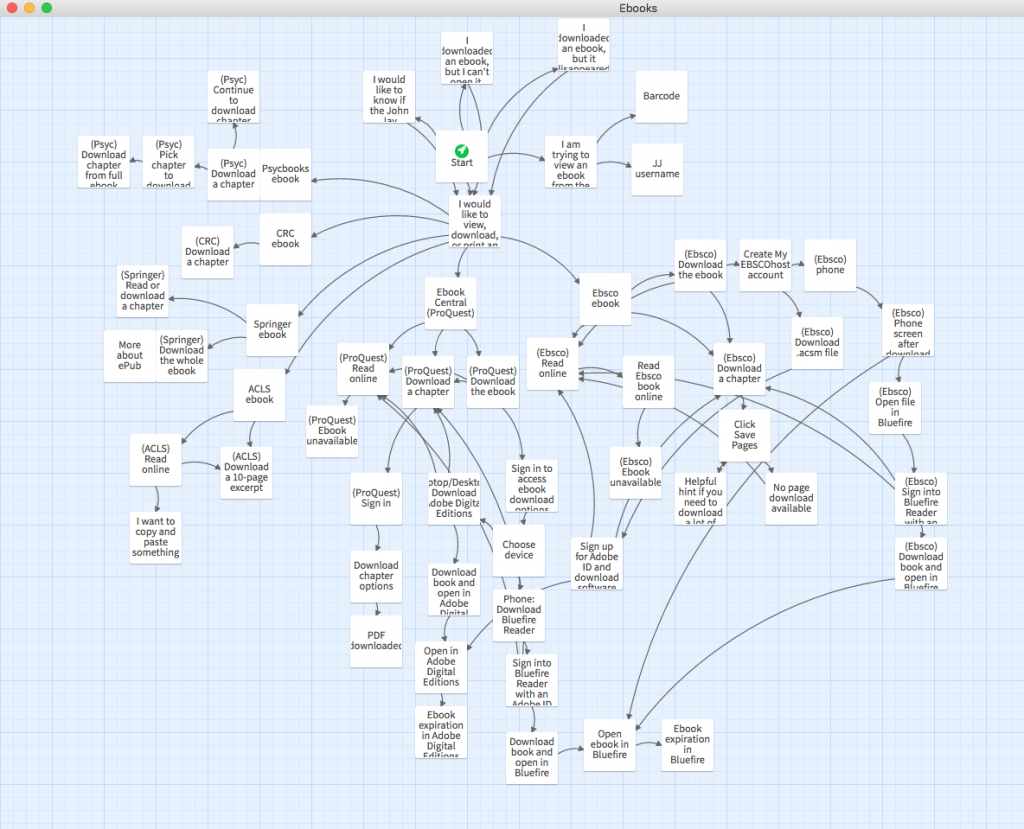
I found Twine to be a great fit for this, since patrons are dealing with ebooks from different vendors, want to do different things with them, and encounter different problems. From a UX point of view, breaking up a tutorial into click-through steps is so much better than presenting users with a wall of text and expecting them to skim through it to figure out what specifically they need to read.

Are you logging in with 1) a barcode or 2) JJ login
View within Twine

The only downside was that I got way too into it and included multiple tasks’ instructions for all of our ebook vendors. It probably took me 10 hours to make this tutorial. Like any web object, it will also require maintenance as time goes on, e.g., updating screenshots when ebook vendors’ UIs change.

I used the downloadable Twine 2 app rather than the web app, so that I didn’t have to worry about accidentally losing my work if I cleared my browser cache. Both output lightweight HTML files with included JavaScript and CSS. (This is especially nice because all the code is bundled into one small file — no need to worry about external JavaScript libraries.)

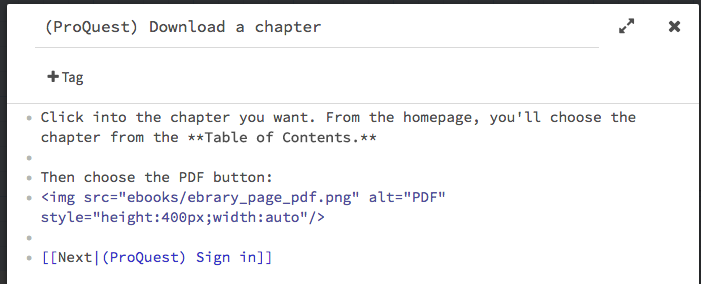
It’s easy and intuitive to get started, especially if you’re already familiar with markup standards like Wiki or Markdown. It also accepts HTML, so you can make external links and include images using HTML tags.

IMG tag (HTML) and double-bracket link (Harlowe)
Harlowe and HTML markup example

Once your tutorial is in a “done” state, just upload the resulting HTML file and any images you used to your webspace.

Note: By default, the page background is black and the text is white, which is hard to read (and not accessible), so if you know a bit of CSS, you can add a custom stylesheet. To change the look of everything, add something like this: tw-story { background:#fff; color:#000; … }.

I can see this particular ebooks tutorial being used as a tool for both patrons and librarians. The feedback from my colleagues has been very positive so far, and we’re already talking about what other topics could be explained with this kind of non-linear instructional material.

The faculty toolbox for online learning


When I code, I love simply copying and pasting from an example website or someone’s open source code. Most of my projects begin as a collage of different code samples that are gradually tuned to my goal. That copy/paste ethos informed my latest work in progress, the Faculty Toolbox.

What’s inside?

The Faculty Toolbox is a goody bag for John Jay faculty who teach online. Inside, there are special library modules they can drag & drop into a course shell; simple instructions for embedding streaming videos; a proxied link generator; and basic info about library liaisons and how I, the Emerging Technologies & Distance Services Librarian, can support online teaching.

It’s a little thing, but it’s a big thing. The Toolbox has been a conversation piece in multiple meetings I’ve been in, and whenever I unveil it, there’s definitely an ‘ooh!’ response to seeing a collection of useful resources prepackaged and offered on a single page. It’s not just a toolbox; it’s a gateway.

Goody bag + cave of wonders

The terminology I use is important. “Toolbox,” “goody bag,” “starter kit” — these are all phrases that call to mind a plethora of shiny items without being overbearing. There’s no “template” or even “guide” happening here; this is a partnership between the library and faculty, rather than a service or directive. And phrases like “generator” or “drag and drop” are derived from exciting action verbs that imply quickness and ease.

That intentional terminology is a response to one barrier to using library resources in online classes. It’s not that it’s difficult, per se, but it’s a bummer to have to scurry all over the library website(s) to gather teaching materials for students. By all means, that’s part of creating course curricula — but the simpler things, like linking to APA/MLA citation guides, should be easy as pie, and we make it so.

Lastly, the Toolbox can be a Cave of Wonders, too. So many faculty haven’t realized the richness of our streaming video collections. When I show it to them (or when they glance at the sample videos I linked to), a whole new world of engaging course content opens up.

Placement & promotion

The Faculty Toolbox is linked from our Faculty Resources list, where they can also find important information about citation metrics and purchase requests. It’s also linked from the John Jay Online faculty resources page, and it’s been emailed to all JJO instructors, too. And in the fall, I’ll be showing it off right and left at a number of workshops in different contexts — Faculty Development Day, Blackboard training workshops, and more.

Blackboard modules from the Library

Our Toolbox was inspired by the one at FIT, which was created by Helen Lane. She mentioned this at an ACRL/NY Distance Ed SIG last year, and it’s an excellent example. Take a look — she makes it so easy to embed many things.

What else would be appropriate to include in the Toolbox?

Analyzing EZproxy logs with Python

We use EZproxy to provide off-campus users with access to subscription resources that require a campus-specific login. Every time a user visits an EZproxy-linked page (mostly by clicking on a link in our list of databaes), that activity is logged. The logs are broken up monthly as either complete (~1 GB for us) or abridged (~10 MB). The complete logs look something like this:

ezproxy log guide
EZproxy log snippet example — click to enlarge

The complete logs log almost everything, including all the JavaScript and favicons loaded onto the page the user signs into. Hence why they are a gig large. The abridged logs have the same format as the illustration above, but keep only the starting point URLs (SPUs) and are much easier to handle. (Note that your configuration of EZproxy may differ from mine — see OCLC’s log format guide.)

We can get pretty good usage stats from the individual database vendors, but with monthly logs like these, why not analyze them yourself? You could do this in Excel, but Python is much more flexible, and much faster, and also, I’ve already written the script for you. It very hackily analyzes on- vs. off-campus vs. in-library use, as well as student vs. faculty use.

Use it on the command line like so:
python ezp-analysis.py [directory to analyze] [desired output filename.csv]

Screen Shot 2014-04-22 at 11.46.10 AM

Run it over the SPU logs, as that’ll take much less time and will give you a more useful connection count — that is, it will only count the “starting point URL” connections, rather than every single connection (javascript, .asp, favicon, etc.), which may not tell you much.

The script will spit out a CSV that looks like this:

ezproxy analysis script output

With which you can then do as you please.

Caveats

  • “Sessions” are different from “connections.” Sessions are when someone logs into EZproxy and does several things; a connection is a single HTTP request. Sessions can only be tracked if they’re off-campus, as they rely on a session ID. On-campus EZproxy use doesn’t get a session ID and so can only be tracked with connections, which are less useful. On-campus use doesn’t tell us anything about student vs. faculty use, for instance.
  • Make sure to change the IP address specifications within the script. As it is, it counts “on campus” as IP addresses beginning with “10.” and in-library as beginning with “10.11.” or “10.12.”
  • This is a pretty hacky script. I make no guarantees as to the accuracy of this script. Go over it with a fine-toothed comb and make sure your output lines up with what you see in your other data sources.
  • Please take a good look at the logs you’re analyzing and familiarize yourself with them — otherwise you may get the wrong idea about the script’s output!
  • Things you could add to the script: analysis of SPUs; time/date patterns; …

Preliminary findings at John Jay

Here’s one output of the data I made, with the counts of on-campus, off-campus, and in-library connections pegged by month from July 2008 to preset, overlaid with lines of best fit:

Click for larger
Click for larger

Off-campus connection increase: Between 2008 and 2014, database use off-campus saw an increase of ballpark 20%. Meanwhile, on-campus use has stayed mostly the same, and library use has dropped by ballpark 15%, although I think I must not be including a big enough IP range, since we’ve seen higher gate counts since 2008. Hm.

Variance: As you can see by the squigglies in the wild ups and downs of the pale lines above, library resource use via EZproxy varies widely month to month. Extreme troughs are obviously when school is not in session. Compared to January, we usually get over 3x the use of library resources in November. The data follows the flow of the school year.

Students vs. faculty: When school is in session, EZproxy use is 90% students and 10% faculty. When school is not in session, those percentages pretty much flip around. (Graph not shown, but it’s boring.) By the numbers, students do almost no research when class is not in session. Faculty are constantly doing research, sometimes doing more when class is not in session.

Data issues: The log for December 2012 is blank. Boo. Throws off some analyses.

If you have suggestions or questions about the script, please do leave a comment!

Life With Pi: Microcomputing in Academia

Microcomputing in AcademiaPresentation given December 6, 2013, as part of the CUNY IT Conference held at John Jay College of Criminal Justice.

Co-presenters and fellow librarians:
Allie Verbovetskaya
Stephen Zweibel
Junior Tidal


Slides (online)
Handout (PDF)


Outline of presentation:

  • Brief introduction to consumer microcomputers and microcontrollers (Allie) — see writeup
  • Microcomputers & pedagogy (Junior)
  • Microcomputers in scholarly research (me)
  • Computational & digital literacy (Stephen)
  • Demonstrations of projects built by presenters
    • LibraryBox: repository available via its own wifi signal (Stephen)
    • OwnCloud: Dropbox-like cloud storage (Allie)
    • Scan a book or enter ISBN, get an auto-citation (Junior)
    • Twitter bot: @mechanicalpoe (me)
    • Light level logger: demo of a 95¢ sensor wired on a breadboard (me)

My part of the presentation follows.

Microcomputers in scholarly research

raspberry pi schematic

Microcomputers come, of course, from computer science research, but they have research applications across just about every discipline — every instance where you might need to do computational work for cheap and don’t mind getting your hands a little dirty setting up these small computers. Scientists, humanists, and artists have all found uses for microcomputers in their work.

A few examples

Applications in the lab & studio

  • Cheap, disposable computing
    • The big draw, of course, is that these are very moderately priced, so cheap that they can be thought of as disposable — and definitely re-purposable. Project pivot? Or something went wrong? No problem — just wipe the computer, reinstall the disk image, and you’ve got a clean slate, no problem.
  • basic sensorsSensors!
    • In my survey of how consumer microcomputers like the Raspberry Pi, Arduino, and BeagleBone are used, many projects used them to log data using sensors. As we’ve seen in the past five years, all kinds of sensors have dropped massively in price, making them easy to integrate into your project. Sensors log data like temperature, humidity, radioactivity, motion, light, sound, GPS, velocity, and so on — any measure of your environment. Many of these sensors can be purchased for $10 or less by now.
  • Clusters!
    • Because they’re cheap to buy and can play nice together, some researchers have hooked microcomputers together to form a cluster or a supercomputer. This means that you can scale your computational power.
  • Prototypes!
    • Small, cheap computers can be used to throw something together that you might then build out with better materials. The Raspberry Pi, for example, is meant to be tinkered with — so you can wire and rewire sensors to a breadboard and write programs to put together a proof of concept before you even think about a soldering iron, and before bringing out the big guns of pricier computers.
  • Integration with other machines!
    • Like any computer, they can be hooked up to power or control other machines, like 3D printers or digital signage or quadrocopters. All of these cool things are now within the reach of both hobbyists and researchers alike.

Advantages

  • Low-cost (stretch that grant!)
    • We all feel the constraints of our budget, whether we’re working within a department that’s had to cut back or we’re trying to stretch out grant money. With some elbow grease, you get a lot of bang for your buck with these low-cost, low-power machines.
  • Tight control over your machines
    • Moreover, because these are simple computers and are designed to be opened up and built on top of, your understanding of your machines can get very deep and technical. With an open source operating system, and using open source software, you can know your machines inside and out. For projects that might involve sensitive data or for which you might otherwise need tight control over, these small, easy-to-handle machines are a good option.
  • Build on code others in the community have contributed
    • On the one hand, having to write or configure your programs at the code-level might be daunting and time-consuming — but the good news is that so much of what has already been done is out there, open and available for you to build on. You might find that someone has already done half the code you need for your research project, and all you have to do is change the variables.
  • Publish & brag
    • These consumer microcomputers are pretty recent, and in my survey, most papers I looked at were published in the last year or two. So it’s a hot topic!

Sample scholarly publication titles

  • Nagy, T., & Gingl, Z. (2013). Low-cost photoplethysmograph solutions using the Raspberry Pi.
  • Petteri, T., Raymond P., N., Hemi, M., Kenneth, K., Dominique, D., Claude, G., & Howard M., C. (n.d). Basic Neuroscience: An inexpensive Arduino-based LED stimulator system for vision research. Journal Of Neuroscience Methods211227-236. doi:10.1016/j.jneumeth.2012.09.012
  • Kale, N., & Malge, P. (2013). Design and Implementation of Photo Voltaic System: Arduino Approach. International Journal Of Computer Applications76(1-16), 21-26.
  • D’Ausilio, A. (2012). Arduino: A low-cost multipurpose lab equipment. Behavior Research Methods44(2), 305-313. doi:10.3758/s13428-011-0163-z
  • ElShafee, A., El Menshawi, M., & Saeed, M. (2013). Integrating Social Network Services with Vehicle Tracking TechnologiesInternational Journal Of Advanced Computer Science & Applications4(6), 124-132.
  • Leeuw, T., Boss, E. S., & Wright, D. L. (2013). In situ Measurements of Phytoplankton Fluorescence Using Low Cost ElectronicsSensors (14248220)13(6), 7872-7883. doi:10.3390/s130607872
  • Awelewa, A., Mbanisi, K., Majekodunmi, S., Odigwe, I., Agbetuyi, A., & Samuel, I. A. (2013). Development of a Prototype Robot Manipulator for Industrial Pick-and-Place OperationsInternational Journal Of Mechanical & Mechatronics Engineering13(5), 20-28.
  • Alves, N. (2010). Implementing Genetic Algorithms on Arduino Micro-Controllers. [working paper, arXiv]
  • Jha, N., Singh Naruka, G., & Dutt Sharma, H. (2013). Design of Embedded Control System Using Super-Scalar ARM Cortex-A8 for Nano-Positioning Stages in Micro-Manufacturing. Signal & Image Processing: An International Journal4(4), 71-82. doi:10.5121/sipij.2013.4406

Plus you’ll find lots of art installations!  See this great list of installations using Arduino, for example.

P.S.

We put together our presentation using Github as a collaborative writing tool: github.com/szweibel/CUNY-IT-Presentation It was the first time any of us had used Github in this way before. I think it worked well, although there was no built-in way for Github to then display the webpage (had to move our working copy onto another website).

Cross-posted on my personal website

Implementing a simple reference desk logger

Hi readers! I just got back from a wonderful month at the Folger for Early Modern Digital Agendas. Some blog posts resulting from that program are coming soon, but in the meantime, here’s something simple but important that we just put into play.

Why log reference stats?

According to a 2010 article in the Journal Of The Library Administration & Management Section*, 93.6% of New York state public and academic libraries surveyed assessed reference transactions. Which is very impressive — although there’s no indication of frequency, meaning that some libraries may be counting something like “statistics week” like we used to do here at John Jay. Stats Week here only happened once a year, which gave us decent insights, but the data were completely unrepresentative of any other week in the year. Most of what we knew about our reference service was anecdotal. As someone who considers herself a budding datahead, this was a situation where the data could tell us lots of things! Such as…

  • Further inform us how to staff reference desk during different hours / days / weeks
  • In aggregate, impressive stats about our reference service to tout
  • Trends in reference: what new tutorials or info we should put online? Workshops to offer?

Research

We decided to try implementing a reference desk tracker to log every interaction at the reference desk. This required buy-in from our colleagues, since it was a significant change in their reference desk activity, but overall the vibe was positive. I researched and considered packages like Gimlet (paid), RefTracker (paid), and Libstats (free). Stephen Zweibel from Hunter also pointed me to his own creation, Augur (free), which is extremely impressive (and makes incredible graphs). These all seemed very robust — but perhaps too robust for our first logging system, considering some pushback about the strain of logging each interaction. Instead, we went with a Google web form.

Implementation

Google web form - reference logFor the first year, we wanted something lightweight, easy to maintain, and easy to set up. I asked my colleagues for advice about the kinds of data they wanted to log and see, then made a simple web form.

All responses are automatically timestamped and sent to a spreadsheet. Only one form item is required: what type of question was it? (Reference short/medium/long, directional, technical.) The rest of the form items are optional. Requiring less information gives us less data, but allows a busy librarian to spend two seconds on the logger.

Our systems manager set up the reference computers such that the form popped up on the side of the screen whenever anyone logged in. After a month, we logged almost 400 interactions (summers are slow) and got some valuable data. We’re now reevaluating the form items to finalize them before the semester starts.

Analysis

Screen Shot 2013-08-01 at 2.11.14 PMScreen Shot 2013-08-01 at 2.11.18 PMWhat do we do with the data? I download the data on the first of each month and load it into a premade Excel file that populates tally tables and spits out ugly but readable charts. I compile these and send a monthly stats report to everyone. It is critical that the people logging the data get to see the aggregate results — otherwise, why contribute to an invisible project?

In the future, I’ll compare the month’s data to the same month last year, as well as the yearly average. I’m already getting excited!

* McLaughlin, J. (2010). Reference Transaction Assessment: A Survey of New York State Academic and Public Libraries. Journal Of The Library Administration & Management Section, 6(2), 5-20.