Hi readers! I just got back from a wonderful month at the Folger for Early Modern Digital Agendas. Some blog posts resulting from that program are coming soon, but in the meantime, here’s something simple but important that we just put into play.
Why log reference stats?
According to a 2010 article in the Journal Of The Library Administration & Management Section*, 93.6% of New York state public and academic libraries surveyed assessed reference transactions. Which is very impressive — although there’s no indication of frequency, meaning that some libraries may be counting something like “statistics week” like we used to do here at John Jay. Stats Week here only happened once a year, which gave us decent insights, but the data were completely unrepresentative of any other week in the year. Most of what we knew about our reference service was anecdotal. As someone who considers herself a budding datahead, this was a situation where the data could tell us lots of things! Such as…
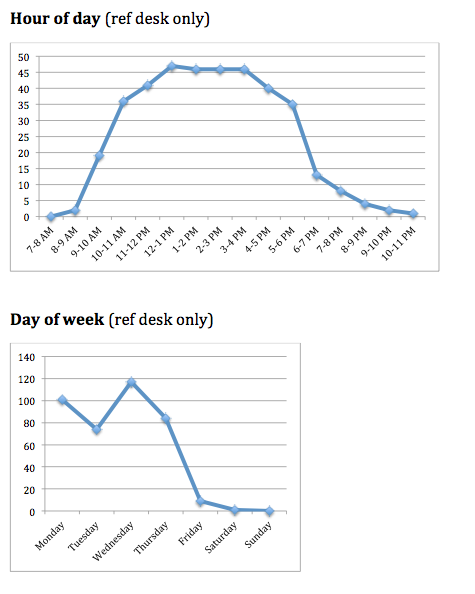
- Further inform us how to staff reference desk during different hours / days / weeks
- In aggregate, impressive stats about our reference service to tout
- Trends in reference: what new tutorials or info we should put online? Workshops to offer?
Research
We decided to try implementing a reference desk tracker to log every interaction at the reference desk. This required buy-in from our colleagues, since it was a significant change in their reference desk activity, but overall the vibe was positive. I researched and considered packages like Gimlet (paid), RefTracker (paid), and Libstats (free). Stephen Zweibel from Hunter also pointed me to his own creation, Augur (free), which is extremely impressive (and makes incredible graphs). These all seemed very robust — but perhaps too robust for our first logging system, considering some pushback about the strain of logging each interaction. Instead, we went with a Google web form.
Implementation
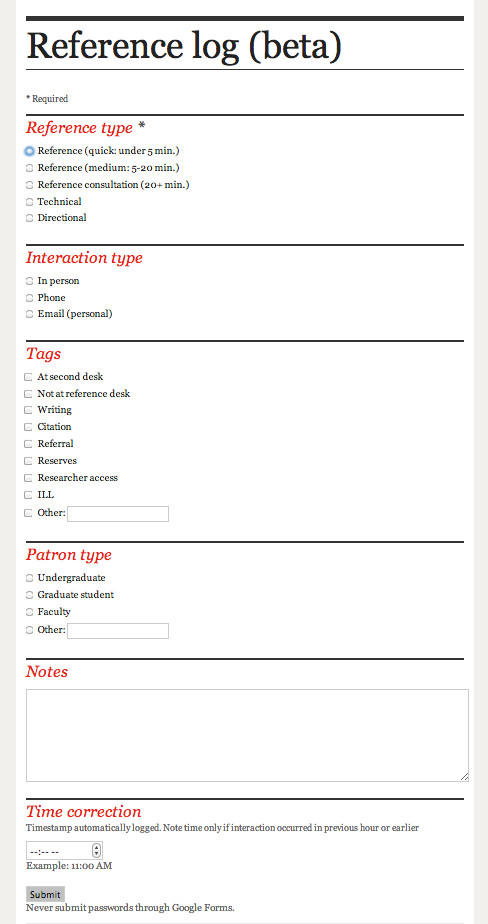
 For the first year, we wanted something lightweight, easy to maintain, and easy to set up. I asked my colleagues for advice about the kinds of data they wanted to log and see, then made a simple web form.
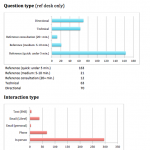
All responses are automatically timestamped and sent to a spreadsheet. Only one form item is required: what type of question was it? (Reference short/medium/long, directional, technical.) The rest of the form items are optional. Requiring less information gives us less data, but allows a busy librarian to spend two seconds on the logger.
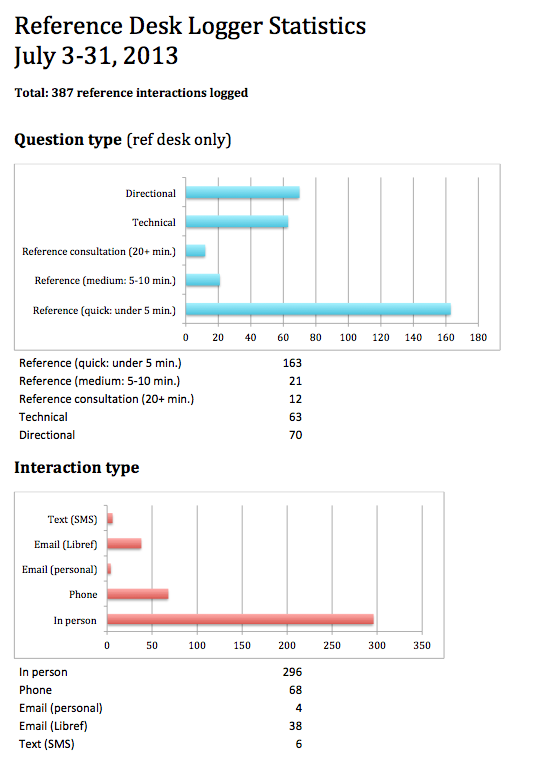
Our systems manager set up the reference computers such that the form popped up on the side of the screen whenever anyone logged in. After a month, we logged almost 400 interactions (summers are slow) and got some valuable data. We’re now reevaluating the form items to finalize them before the semester starts.
Analysis
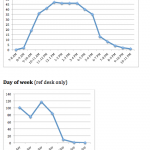 What do we do with the data? I download the data on the first of each month and load it into a premade Excel file that populates tally tables and spits out ugly but readable charts. I compile these and send a monthly stats report to everyone. It is critical that the people logging the data get to see the aggregate results — otherwise, why contribute to an invisible project?
In the future, I’ll compare the month’s data to the same month last year, as well as the yearly average. I’m already getting excited!
* McLaughlin, J. (2010). Reference Transaction Assessment: A Survey of New York State Academic and Public Libraries. Journal Of The Library Administration & Management Section, 6(2), 5-20.
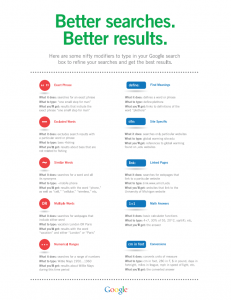 It’s kinda old, but the tips still work! I did some googling when I had a minute to find out if they offered that posters for downloads, and lo and behold, there’s a whole trove of educational material from Google. Their ‘lesson plan search‘ page has a handful of posters like the one above.
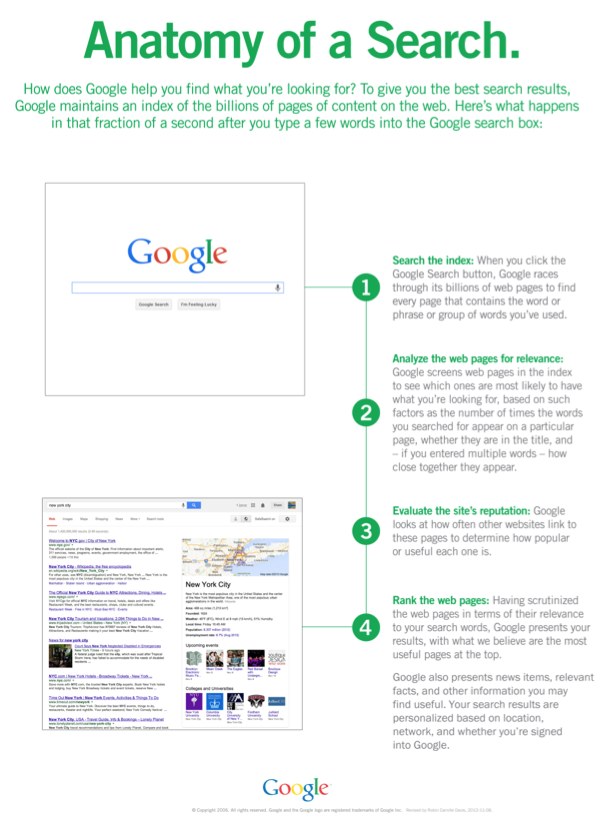 The PDF (2 MB) prints out to 17×22 inches.