Tag: stats

Analyzing EZproxy logs with Python

We use EZproxy to provide off-campus users with access to subscription resources that require a campus-specific login. Every time a user visits an EZproxy-linked page (mostly by clicking on a link in our list of databaes), that activity is logged. The logs are broken up monthly as either complete (~1 GB for us) or abridged (~10 MB). The complete logs look something like this:

ezproxy log guide
EZproxy log snippet example — click to enlarge

The complete logs log almost everything, including all the JavaScript and favicons loaded onto the page the user signs into. Hence why they are a gig large. The abridged logs have the same format as the illustration above, but keep only the starting point URLs (SPUs) and are much easier to handle. (Note that your configuration of EZproxy may differ from mine — see OCLC’s log format guide.)

We can get pretty good usage stats from the individual database vendors, but with monthly logs like these, why not analyze them yourself? You could do this in Excel, but Python is much more flexible, and much faster, and also, I’ve already written the script for you. It very hackily analyzes on- vs. off-campus vs. in-library use, as well as student vs. faculty use.

Use it on the command line like so:
python ezp-analysis.py [directory to analyze] [desired output filename.csv]

Screen Shot 2014-04-22 at 11.46.10 AM

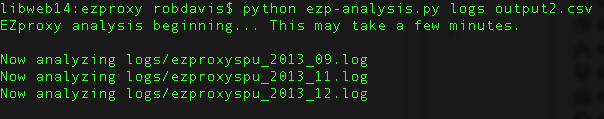
Run it over the SPU logs, as that’ll take much less time and will give you a more useful connection count — that is, it will only count the “starting point URL” connections, rather than every single connection (javascript, .asp, favicon, etc.), which may not tell you much.

The script will spit out a CSV that looks like this:

ezproxy analysis script output

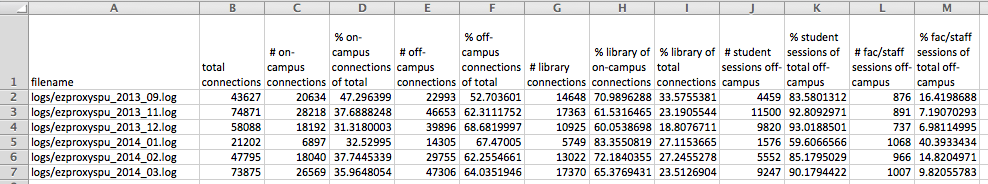
With which you can then do as you please.

Caveats

  • “Sessions” are different from “connections.” Sessions are when someone logs into EZproxy and does several things; a connection is a single HTTP request. Sessions can only be tracked if they’re off-campus, as they rely on a session ID. On-campus EZproxy use doesn’t get a session ID and so can only be tracked with connections, which are less useful. On-campus use doesn’t tell us anything about student vs. faculty use, for instance.
  • Make sure to change the IP address specifications within the script. As it is, it counts “on campus” as IP addresses beginning with “10.” and in-library as beginning with “10.11.” or “10.12.”
  • This is a pretty hacky script. I make no guarantees as to the accuracy of this script. Go over it with a fine-toothed comb and make sure your output lines up with what you see in your other data sources.
  • Please take a good look at the logs you’re analyzing and familiarize yourself with them — otherwise you may get the wrong idea about the script’s output!
  • Things you could add to the script: analysis of SPUs; time/date patterns; …

Preliminary findings at John Jay

Here’s one output of the data I made, with the counts of on-campus, off-campus, and in-library connections pegged by month from July 2008 to preset, overlaid with lines of best fit:

Click for larger
Click for larger

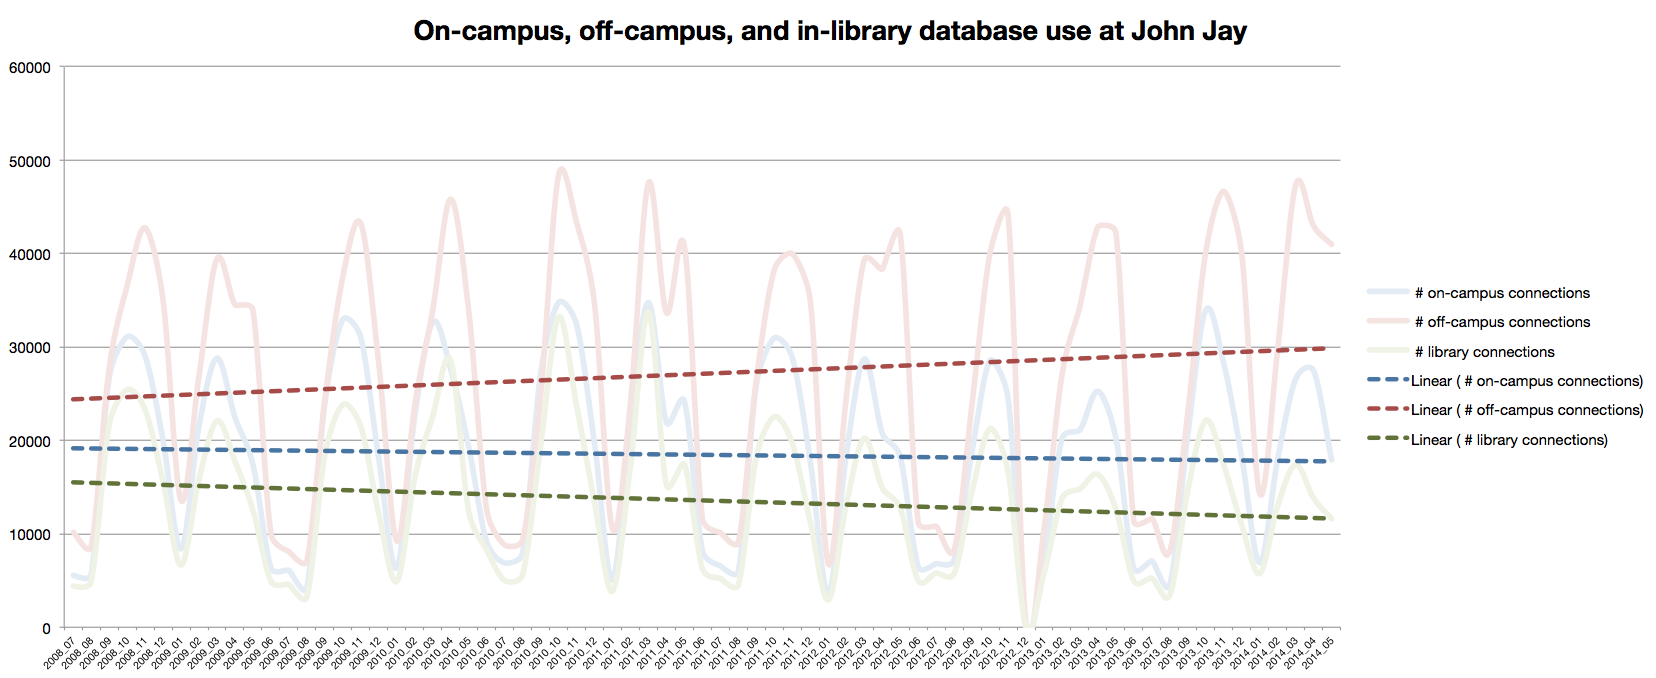
Off-campus connection increase: Between 2008 and 2014, database use off-campus saw an increase of ballpark 20%. Meanwhile, on-campus use has stayed mostly the same, and library use has dropped by ballpark 15%, although I think I must not be including a big enough IP range, since we’ve seen higher gate counts since 2008. Hm.

Variance: As you can see by the squigglies in the wild ups and downs of the pale lines above, library resource use via EZproxy varies widely month to month. Extreme troughs are obviously when school is not in session. Compared to January, we usually get over 3x the use of library resources in November. The data follows the flow of the school year.

Students vs. faculty: When school is in session, EZproxy use is 90% students and 10% faculty. When school is not in session, those percentages pretty much flip around. (Graph not shown, but it’s boring.) By the numbers, students do almost no research when class is not in session. Faculty are constantly doing research, sometimes doing more when class is not in session.

Data issues: The log for December 2012 is blank. Boo. Throws off some analyses.

If you have suggestions or questions about the script, please do leave a comment!

Successful social media in our library + using Bit.ly

We’ve upped our social game this academic year since an inspiring LACUNY talk in September 2013. On our library’s Facebook, Twitter, and Instagram, we follow a schedule of Mug Shot Mondays and Throwback Thursdays (#tbt), with other posts peppered in between. #tbt has been super successful on Facebook, in terms of views and clicks, especially since the main college account often re-shares our posts.

Facebook insights screenshot
Facebook insights December 2013 to January 2014 (I took a 3-week break, hence sporadic posts).
Blue bar = clicks on content; pink bar = Likes, comments, and shares

Our posts have been genuine geek-outs (how cool are these old photos!), but they’ve also been diagnostics and test runs. The students don’t know it yet, but we’ll be leveraging the popularity of our weekly posts to promote our upcoming Digital Collections site and next year’s 50th Anniversary Exhibit. What works? What doesn’t work?

We’re realists — we know that our visual posts are probably one “oh, that’s cool” blip in our students’ Facebook feeds. But as optimists, we always include a relevant link (often in a subscription database) and a source link (to our Special Collections pages), with the hope that we’ll serendipitously inspire further research and interest in our unique materials.

A successful #tbt post
A successful Throwback Thursday post

Facebook’s insights page can give us a pretty good idea of whether people are clicking through to the links we provide. If the link goes to a page on our servers, Google Analytics will also record that click-through. But there’s one more way that I like to track the effectiveness of our links.

Using bit.ly to track success of social media posts

Bit.ly admin page
Bit.ly admin page

You can’t see it in the screenshot above, but Colonel Sandusky’s bio from the Facebook photo post got 5 clicks. The shortlink to our Archives page has 42 clicks total, from all of our Archives-related Facebook posts.

Three advantages of Bit.ly:

  • The shortlinks (e.g., bit.ly/jjpexp) look nice in short posts, especially compared to our enormous EZproxy links
  • If you need to include a long link on a poster or slide, a shortlink will make your viewers happy
  • With an account, you can see how often a bit.ly link has been clicked

Three drawbacks to Bit.ly:

  • You can’t export a spreadsheet, to my knowledge, so you’d have to cobble together data if you want a big-picture view. But for a quick peek, it works great
  • You can’t submit a link more than once. So our Archives link has 40+ clicks on 5+ posts
  • If you click on the link yourself, even from the admin view, that adds a click to your stats, giving you a distorted view

Two tips for using Bit.ly:

  • See the pencil next to the short link? That means you can customize the link! As you can see, ours in the above image are jjnewslet, jjdcpeek, jjhamby, and mapcrime. Much more human-friendly than something like 1Xoj5nW. (Please customize your shortlink if you’re putting it on a slide or poster!)
    bitly edit  Yikes! »»»  bitly edited  Much better.
  • Edit the link’s title and/or add a note on your admin view to remind yourself where/why each link is listed. Do this especially if your link has an EZproxy prefix, otherwise every link will be title “Log in with your xxxx username…”
    bitly edited entry

Drawing preliminary conclusions, even our most popular Facebook posts don’t bring in many click-throughs. A little disappointing, but that’s to be expected. People use Facebook when they want to be distracted and scroll quickly through brief diversions, not necessarily when they want to dive deeply into a topic.

Views and clicks are only one measure of success in social media. These numbers are the easiest to track and give the quickest gratification after the effort you put in. But true outreach means increased use and improved perception of the library, which is much harder to quantify at a granular level. (Suggestions?)

I’ll keep updating with other tales and tips for success in social media in our library. Other tips and examples are welcome!