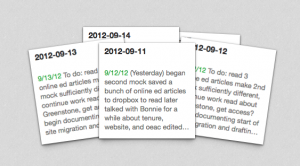
It’s self-evaluation time again! It’s the second year I’ve had to do this for my current job. Last year, I found it enormously helpful to quantify and visualize the activities I’d done in the given time period. I use the daily “Done today” entries I write in Evernote, a Python script I wrote last year, the BeautifulSoup Python library, and Voyant Tools to get a holistic look at what I did this year.
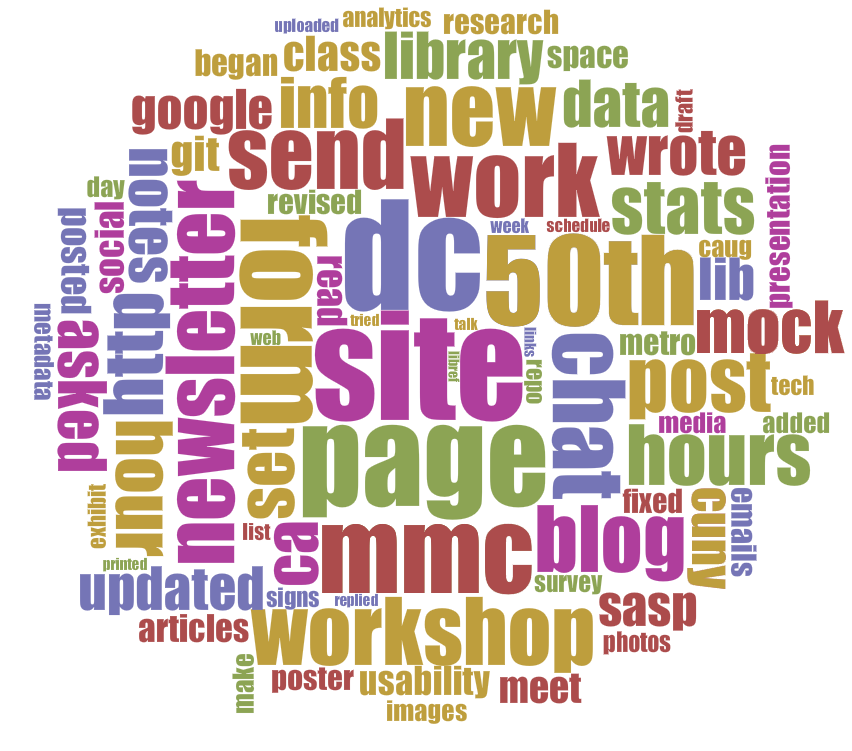
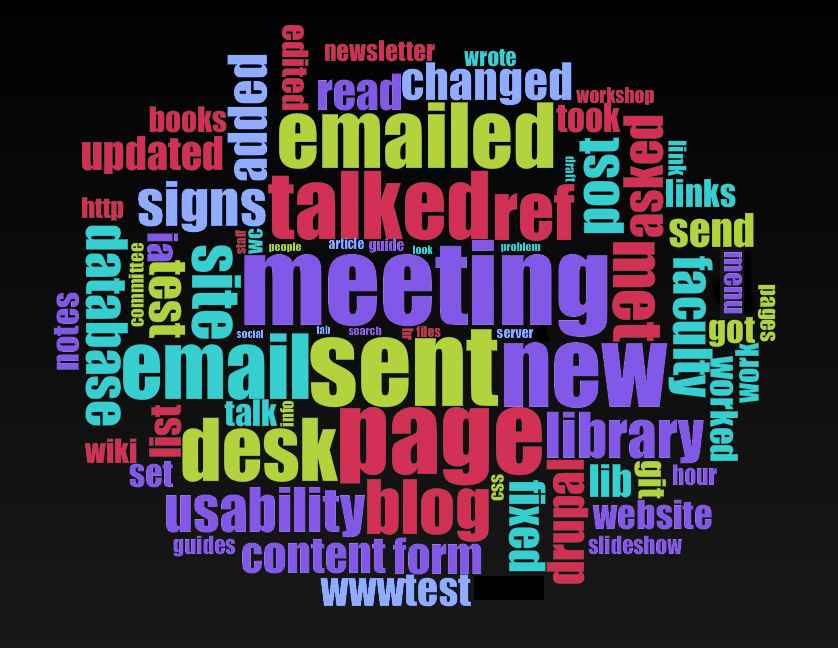
Voyant Tools allow different views of the data. One is Cirrus word clouds. (When used in combo with other data tools, word clouds are useful.) The image at the top of this entry is the word cloud that ignores common stop words, my colleagues’ names, and the words ref, desk, email/s/ed, met, meeting, talked,hr (hour), and sent.
Here’s the word cloud that only ignores common stop words:
We use EZproxy to provide off-campus users with access to subscription resources that require a campus-specific login. Every time a user visits an EZproxy-linked page (mostly by clicking on a link in our list of databaes), that activity is logged. The logs are broken up monthly as either complete (~1 GB for us) or abridged (~10 MB). The complete logs look something like this:
EZproxy log snippet example — click to enlarge
The complete logs log almost everything, including all the JavaScript and favicons loaded onto the page the user signs into. Hence why they are a gig large. The abridged logs have the same format as the illustration above, but keep only the starting point URLs (SPUs) and are much easier to handle. (Note that your configuration of EZproxy may differ from mine — see OCLC’s log format guide.)
We can get pretty good usage stats from the individual database vendors, but with monthly logs like these, why not analyze them yourself? You could do this in Excel, but Python is much more flexible, and much faster, and also, I’ve already written the script for you. It very hackily analyzes on- vs. off-campus vs. in-library use, as well as student vs. faculty use.
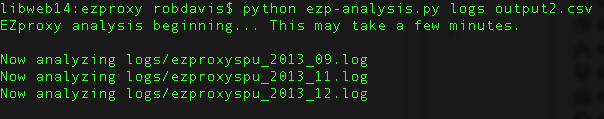
Use it on the command line like so: python ezp-analysis.py [directory to analyze] [desired output filename.csv]
Run it over the SPU logs, as that’ll take much less time and will give you a more useful connection count — that is, it will only count the “starting point URL” connections, rather than every single connection (javascript, .asp, favicon, etc.), which may not tell you much.
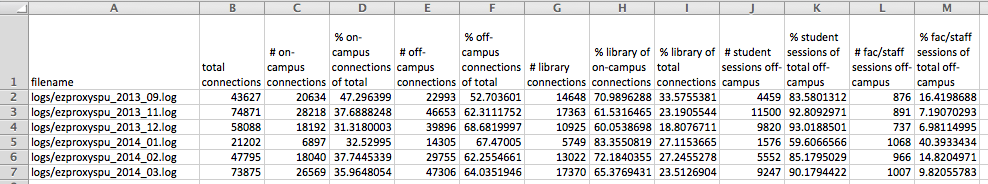
The script will spit out a CSV that looks like this:
With which you can then do as you please.
Caveats
“Sessions” are different from “connections.” Sessions are when someone logs into EZproxy and does several things; a connection is a single HTTP request. Sessions can only be tracked if they’re off-campus, as they rely on a session ID. On-campus EZproxy use doesn’t get a session ID and so can only be tracked with connections, which are less useful. On-campus use doesn’t tell us anything about student vs. faculty use, for instance.
Make sure to change the IP address specifications within the script. As it is, it counts “on campus” as IP addresses beginning with “10.” and in-library as beginning with “10.11.” or “10.12.”
This is a pretty hacky script. I make no guarantees as to the accuracy of this script. Go over it with a fine-toothed comb and make sure your output lines up with what you see in your other data sources.
Please take a good look at the logs you’re analyzing and familiarize yourself with them — otherwise you may get the wrong idea about the script’s output!
Things you could add to the script: analysis of SPUs; time/date patterns; …
Preliminary findings at John Jay
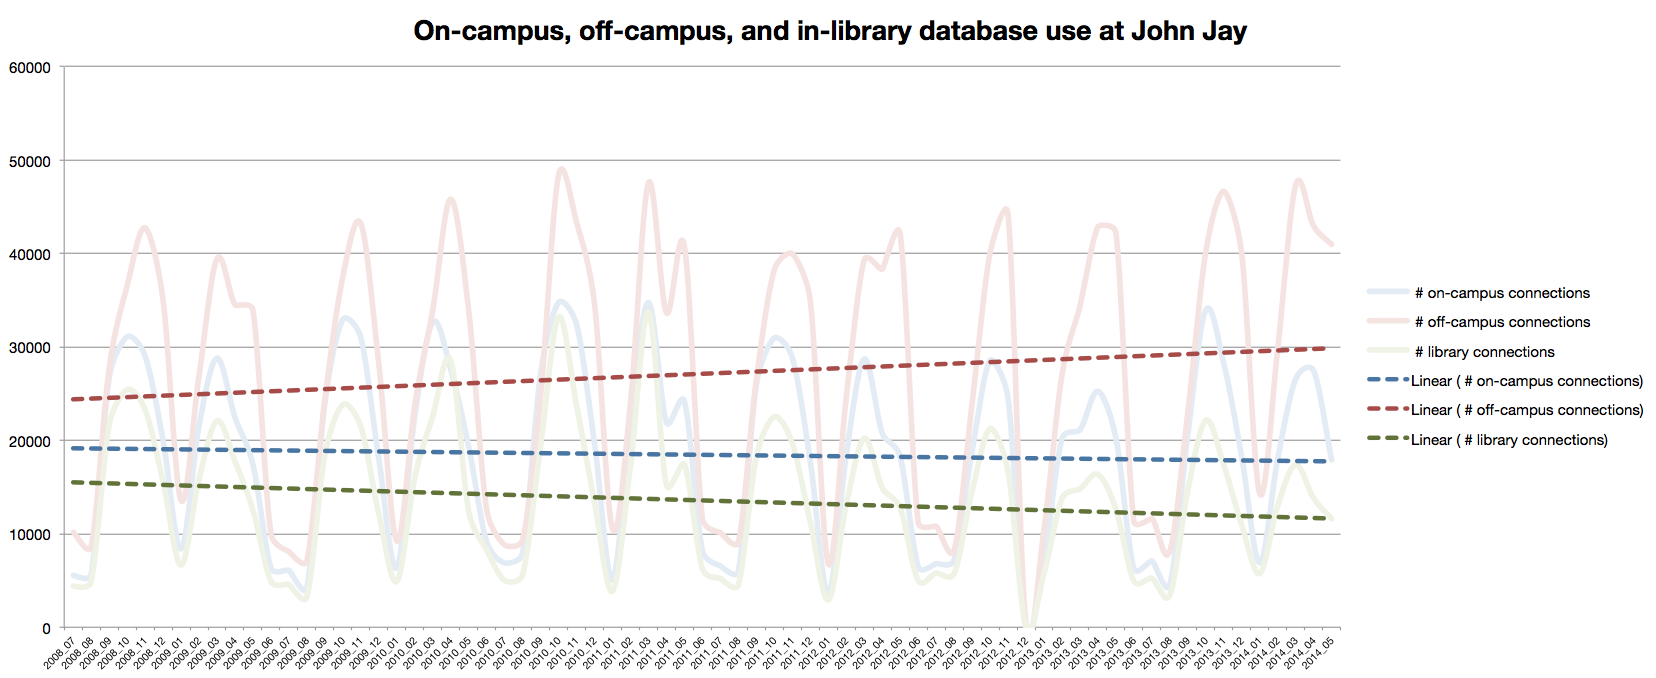
Here’s one output of the data I made, with the counts of on-campus, off-campus, and in-library connections pegged by month from July 2008 to preset, overlaid with lines of best fit:
Click for larger
Off-campus connection increase: Between 2008 and 2014, database use off-campus saw an increase of ballpark 20%. Meanwhile, on-campus use has stayed mostly the same, and library use has dropped by ballpark 15%, although I think I must not be including a big enough IP range, since we’ve seen higher gate counts since 2008. Hm.
Variance: As you can see by the squigglies in the wild ups and downs of the pale lines above, library resource use via EZproxy varies widely month to month. Extreme troughs are obviously when school is not in session. Compared to January, we usually get over 3x the use of library resources in November. The data follows the flow of the school year.
Students vs. faculty: When school is in session, EZproxy use is 90% students and 10% faculty. When school is not in session, those percentages pretty much flip around. (Graph not shown, but it’s boring.) By the numbers, students do almost no research when class is not in session. Faculty are constantly doing research, sometimes doing more when class is not in session.
Data issues: The log for December 2012 is blank. Boo. Throws off some analyses.
If you have suggestions or questions about the script, please do leave a comment!
The library where I work and play, Lloyd Sealy Library at John Jay College of Criminal Justice, has had the privilege to have 130+ items scanned and put online by the Internet Archive (thanks METRO! thanks marketing dept at John Jay!). These range from John Jay yearbooks to Alger Hiss trial documents to my favorites, the NYPD Annual Reports (great images and early data viz).
For each scanned book, IA generates master and derivative JPEG2000 files, a PDF, Kindle/Epub/Daisy ebooks, OCR’d text, GIFs, and a DjVu document (see example file list). IA does a great job scanning and letting us do QA, but because they load the content en masse to the internet, there’s no real reason to give us hard copies or a disk drive full of the files. But we do want them, because we want offline access to these digital derivatives of items we own.
The Programming Historian published another fantastic post this month: Data Mining the Internet Archive Collection. In it, Caleb McDaniel walks us through the internetarchive Python library and how to explore and download items in a collection.
I adapted some of his example Python scripts to download all 133 items in John Jay’s IA collection at once, without having to write lots of code myself or visit each page. Awesome! I’ve posted the code to my Github (sorry in advance for having a ‘miscellaneous’ folder, I know that is very bad) and copied it below.
Note that:
it will take HOURS to download all items, like an hour each, since the files (especially the master JP2s) can be quite large, plus IA probably controls download requests to avoid overloading their servers.
before running, you’ll need to sudo pip install internetarchive in Terminal (if using a Mac) or do whatever is the equivalent with Windows for the internetarchive Python library.
your files will download into their own folders, under the IA identifier, wherever you save this .py file
## downloads all items in a given Internet Archive collection
## See http://programminghistorian.org/lessons/data-mining-the-internet-archive for more detailed info
import internetarchive as ia
coll = ia.Search('collection:xxxxxxxx') #fill this in -- searches for the ID of a collection in IA
## example of collection page: https://archive.org/details/johnjaycollegeofcriminaljustice
## the collection ID for that page is johnjaycollegeofcriminaljustice
## you can tell a page is a collection if it has a 'Spotlight Item' on the left
num = 0
for result in coll.results(): #for all items in a collection
num = num + 1 #item count
itemid = result['identifier']
print 'Downloading: #' + str(num) + '\t' + itemid
Updated Dec. 2015 to reflect changes on the Twitter Apps page. See bottom of post for even more Twitter bot scripts!
If there’s one thing this budding computational linguist finds delightful, it’s computers that talk to us. From SmarterChild to horse_ebooks to Beetlejuice, I love the weirdness of machines that seem to have a voice, especially when it’s a Twitter bot that adds its murmur to a tweetstream of accounts mostly run by other humans.
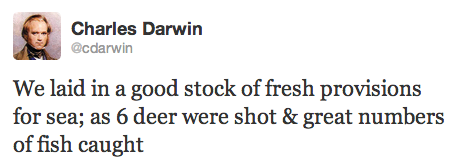
@cdarwin bot tweets lines from Darwin’s ship log “according to the current date and time so that the Tweets shadow the real world. When it’s the 5th of August here, it’s the 5th August on board ship, albeit 176 years in the past.”
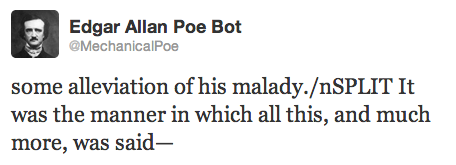
As fun midnight project a few weeks ago, I cobbled together @MechanicalPoe, a Twitter bot that tweets Poe works line by line on the hour from a long .txt file. This slow-tweeting of text is by no means new—@SlowDante is pretty popular, and so is @CDarwin, among many others. In case you want to make your own, here are the quick ‘n’ easy steps I took. This is just one way of doing it—shop around and see what others have done, too.
Step 1. Choose your text & chunk it. (Look, I hate the word chunk as much as the next person, but it’s like, what else are we going to say, nuggetize?) In any case, I chose some texts from Project Gutenberg and copied them into separate .txt files. (Maybe don’t choose a long-winded writer.) I ran a script over them to split them up by sentence and mark sentences longer than 140 characters. (Link to chunking script.) There are other scripts to break up long sentences intelligently, but I wanted to exert some editorial control over where the splits occurred in the texts, so the script I wrote writes ‘SPLIT’ next to long sentences to alert me as I went over the ~600 lines by hand. I copied my chunked texts into one .txt file and marked the beginnings and ends of each individual text. (Link to the finalized .txt file.)
Baby’s first Twitter bot. Tweets Poe hourly, except when it doesn’t.
Step 2. Set up your Twitter developer credentials. Set up your bot’s account, then get into the Applications manager and create a new app. Click the Keys and Access Tokens tab. You’ll see it already gave you a Consumer Key and Consumer Secret right off the bat. Scroll down to create a new Access Token.
Step 3. Configure script. You’ll have to install Tweepy, which takes advantage of the Twitter API using Python. Now take a look at this super-simple 27-line script I wrote based on a few other scripts elsewhere. This script is also on my Github:
#!/usr/bin/env python
# -*- coding: utf-8 -*-
# by robincamille - for mechnicalpoe
# Tweets a .txt file line by line, waiting an hour between each tweet.
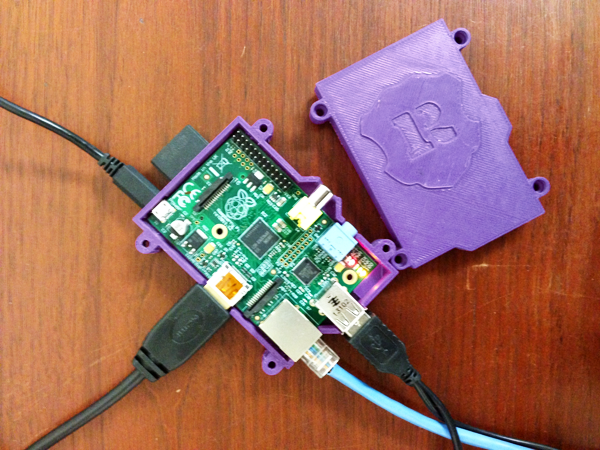
# Must be running all the time, e.g. on a Raspberry Pi, but would be better
# if rewritten to run as a cron task.
#File the bot will tweet from
filename=open('lines.txt','r')
f=filename.readlines()
filename.close()
#Tweet a line every hour
for line in f:
api.update_status(line)
print line
time.sleep(3600) #Sleep for 1 hour</code>
You’ll see that it takes a line from my .txt file, tweets it, and then waits for 3600 seconds (one hour). Fill in your developer credentials, make any changes to the filename and anything else your heart desires.
Step 4. Run script! You’ll notice that this script must always be running—that is, an IDLE window must always be open running it, or a command line window (to run in Terminal, simply write python twitterbot.py, or whatever your filename is). A smarter way would be to run a cron task every hour, and you should probably do that instead, but that requires rewriting the last part of the script. For me, MechanicalPoe runs on my Raspberry Pi, and it’s pretty much the only thing that’s doing now, so it’s fine for it to be running that script 24/7.
This is how Edgar Allan Poe lives on… Note the lovely 3D-printed case made for me by pal Jeff Ginger
Gotchas. So you might encounter some silly text formatting stuff, like encoding errors for quotation marks (but probably not, since the script declares itself UTF-8). You might also make a boo-boo like I did and miss a SPLIT (below) or try to tweet an empty line (you’ll get an error message, “Missing stats”). Also, if you choose a poet like Poe whose lines repeat themselves, Twitter will give you a “Status is a duplicate” error message. I don’t know how long you have to wait to post, but that’s why there are gaps in Mechanical Poe’s Twitter record. The script I wrote is too simple to handle this error elegantly. It just crashes, and when you restart it, you’ll have to specify for line in f[125:]: (whatever line it is in your text file, minus 1) to start there instead.
Update Dec. 2015: My colleague Mark Eaton and I led a one-day Build Your Own Twitter Bot workshop. We built five ready-made Twitter bots. See the tutorial and get the Python scripts on my GitHub. I updated the above tutorial to reflect a different Apps panel in Twitter, too.
I’ve mentioned before that I keep a professional journal as a quick way to keep tabs on the projects I’m doing and what I should be focusing on. It takes the form of a 3-part note in Evernote: Done, To Do, and Backburner.
My annual evaluation is coming up, for which I have to write a self-evaluation summarizing all the things I did this year. It’s hard to slow down and think big-picture, and it’s hard to remember what exactly my priorities were last fall when I’m so caught up in what I’m doing now.
Output as HTML
To get a jump-start, I wrote a tiny Python script to iterate through my notes (exported to HTML). Using BeautifulSoup to climb the trees of my messy and non-standardized notes, it lists out all the things I marked “Done” since September.
I fed the plain text into Voyant Tools, “a web-based reading and analysis environment for digital texts.” It’s probably more interesting and helpful if you use a larger text, but my 8,900-word text had analyses of interest too.
Word cloud using Cirrus in Voyant Tools. Stopwords: Taporware & names of colleagues
Some of these aren’t so surprising. Oh, really, I went to lots of meetings and sent lots of emails? But it’s also easy to see that my priorities for most of the year centered on building the new library website (usability, git, drupal, database) with some side projects thrown in (signs, guides, newsletter, IA).
Here are the word frequency data from Voyant for words occurring more than 25 times (stop words included):
Words in the Entire Corpus. Corpus Term Frequencies provides an ordered list for all the terms’ frequencies appearing in a corpus. As well additional columns can be toggled to show other statistical information, including a small line graph for term frequency across the corpus.
Word counts aren’t the whole story, obvs, but it’s a good place to start for my self-evaluation!
Need help with the Commons?
Email us at [email protected] so we can respond to your questions and requests. Please email from your CUNY email address if possible. Or visit our help site for more information: