February 5, 2015 2:47 PM Edited to add ScienceScape as a way to format your data without having to use Python
February 6, 2015 1:22 PM Edited to add instructions for cleaning index keyword data
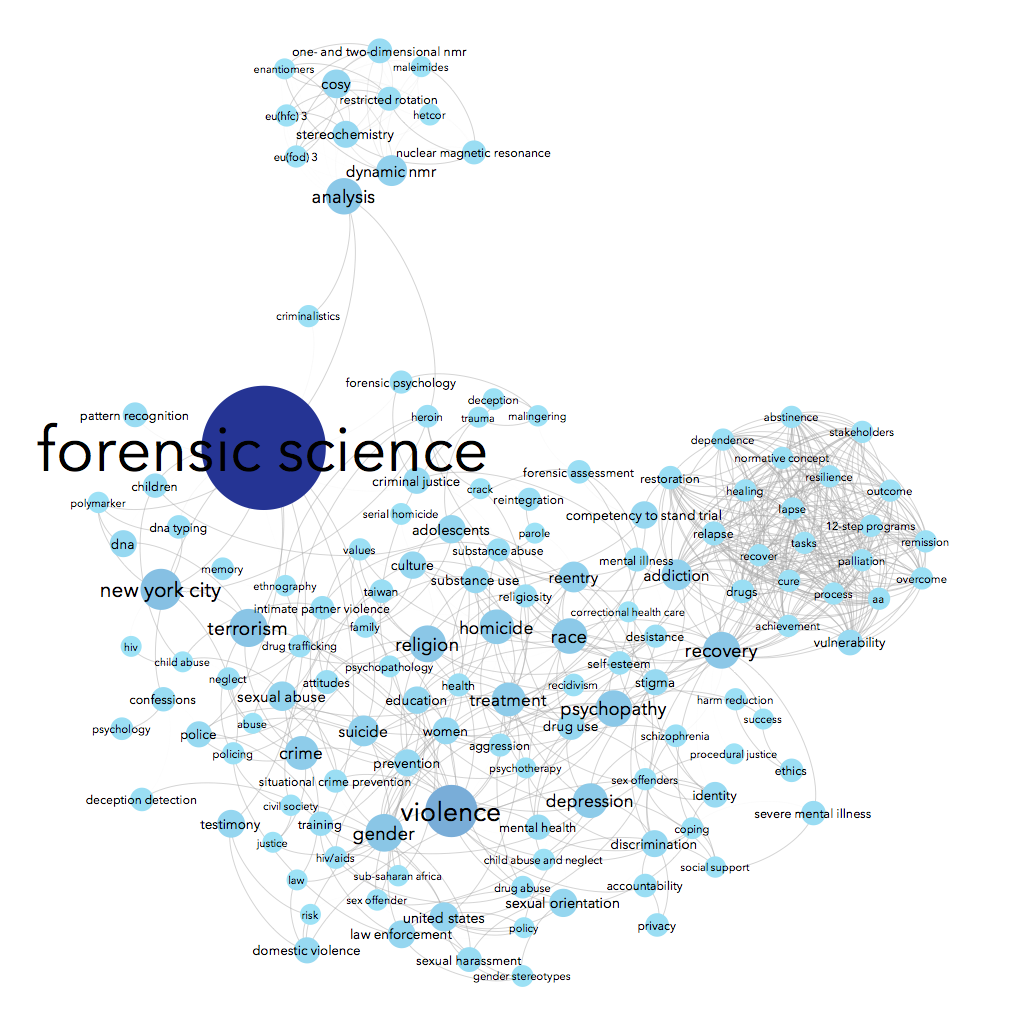
Here’s what I made this morning:

Using data from Scopus about some of the science & social science publications written by John Jay College-affiliated authors, we can see connections between the top keywords listed for each article. For instance, John Jay faculty & grad students often write about forensic science — no surprise there, we have a renowned forensic science department! People who write about forensic science are often also writing about suicide, weapons, DNA, and/or New York City in the same article. Essentially, I made a word cloud that connects keywords that co-occur.
Perhaps you’d like to do this for your institution, too!
Gephi topic map tutorial
You will need:
- Access to Scopus through your institution
- Gephi (no experience necessary)
- Plain-text editing program like TextWrangler (familiarity with regular expressions helpful)
- Optional: Python 2.7 (some experience necessary)
Time estimation: 1.5-4 hours, depending on your familiarity with the above and on how much Gephi playtime you give yourself.
Step 1. Get the data.
Many databases will let you export some index data. For this, I used Scopus, a subscription database that offers access to publications in life sciences, social sciences, health sciences, and physical sciences. (See their breakdown of content coverage.) Other possible data sources include Ebsco (export limited to 100 queries at a time) and Web of Knowledge (export limited to 500 queries at a time).


