Author: Robin Camille Davis

Implementing a simple reference desk logger

Hi readers! I just got back from a wonderful month at the Folger for Early Modern Digital Agendas. Some blog posts resulting from that program are coming soon, but in the meantime, here’s something simple but important that we just put into play.

Why log reference stats?

According to a 2010 article in the Journal Of The Library Administration & Management Section*, 93.6% of New York state public and academic libraries surveyed assessed reference transactions. Which is very impressive — although there’s no indication of frequency, meaning that some libraries may be counting something like “statistics week” like we used to do here at John Jay. Stats Week here only happened once a year, which gave us decent insights, but the data were completely unrepresentative of any other week in the year. Most of what we knew about our reference service was anecdotal. As someone who considers herself a budding datahead, this was a situation where the data could tell us lots of things! Such as…

  • Further inform us how to staff reference desk during different hours / days / weeks
  • In aggregate, impressive stats about our reference service to tout
  • Trends in reference: what new tutorials or info we should put online? Workshops to offer?

Research

We decided to try implementing a reference desk tracker to log every interaction at the reference desk. This required buy-in from our colleagues, since it was a significant change in their reference desk activity, but overall the vibe was positive. I researched and considered packages like Gimlet (paid), RefTracker (paid), and Libstats (free). Stephen Zweibel from Hunter also pointed me to his own creation, Augur (free), which is extremely impressive (and makes incredible graphs). These all seemed very robust — but perhaps too robust for our first logging system, considering some pushback about the strain of logging each interaction. Instead, we went with a Google web form.

Implementation
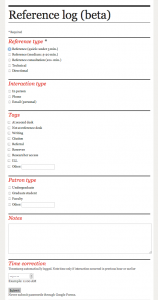
Google web form - reference logFor the first year, we wanted something lightweight, easy to maintain, and easy to set up. I asked my colleagues for advice about the kinds of data they wanted to log and see, then made a simple web form.

All responses are automatically timestamped and sent to a spreadsheet. Only one form item is required: what type of question was it? (Reference short/medium/long, directional, technical.) The rest of the form items are optional. Requiring less information gives us less data, but allows a busy librarian to spend two seconds on the logger.

Our systems manager set up the reference computers such that the form popped up on the side of the screen whenever anyone logged in. After a month, we logged almost 400 interactions (summers are slow) and got some valuable data. We’re now reevaluating the form items to finalize them before the semester starts.

Analysis
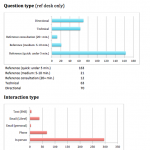
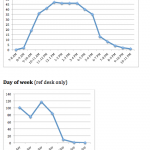
Screen Shot 2013-08-01 at 2.11.14 PMScreen Shot 2013-08-01 at 2.11.18 PMWhat do we do with the data? I download the data on the first of each month and load it into a premade Excel file that populates tally tables and spits out ugly but readable charts. I compile these and send a monthly stats report to everyone. It is critical that the people logging the data get to see the aggregate results — otherwise, why contribute to an invisible project?

In the future, I’ll compare the month’s data to the same month last year, as well as the yearly average. I’m already getting excited!

* McLaughlin, J. (2010). Reference Transaction Assessment: A Survey of New York State Academic and Public Libraries. Journal Of The Library Administration & Management Section, 6(2), 5-20.
Introducing myself to MALLET

Backstory

In my text mining class at GSLIS, we had a lot of ground to cover. It was easy enough to jump into Oracle SQL Developer and Data Miner and plug into the Oracle database that had been set up for us, and we moved on to processing and classifying merrily. But now, a year later, I’m totally removed from that infrastructure. I wanted to review my work from that class before heading to EMDA next (!) week, but reacquainting myself with Data Miner would require setting up the whole environment first. Not totally understanding the Oracle ecosystem, I thought it would be easy enough to set a VirtualBox and implement the Linux setup as needed, but after several failures I gave up and decided to try something new. As it turns out, MALLET not only does classification, but topic modeling, too — something I’d never done before.

What is?

Here’s how I understand it: topic modeling, like other text mining techniques, considers text as a ‘bag of words’ that is more or less organized. It draws out clusters of words (topics) that appear to be related because they statistically occur near each other. We’ve all been subjected to wordles — this is like DIY wordles that can get very specific and can seem to approach semantic understanding with statistics alone.

One tool that DH folks mention often is MALLET, the MAchine Learning for LanguagE Toolkit, open-source software developed at UMass Amherst starting in 2002. I was pleased to see that it not only models topics, but does the things I’d wanted Oracle Data Miner to do, too — classify with decision trees, Naïve Bayes, and more. There are many tutorials and papers written on/about MALLET, but the one I picked was Getting Started with Topic Modeling and MALLET from The Programming Historian 2, a project out of CHNM. The tutorial is very easy to follow and approaches the subject with a DH-y literariness.

Exploration

One of my favorite small test texts is personally significant to me — my grandmother’s diary from 1943, which she kept as a 16-year-old girl in Hawaii. I transcribed it and TEI’d it a while ago. I split up my plain-text transcript by month, stripped month and day names from the text (so words wouldn’t necessarily cluster around ‘april’), and imported the 12 .txt files into MALLET. Following the tutorial’s instructions, I ran train-topics and came out with data like this:

January
home
diary
school
ve
today
feel
god
parents
war
eyes
hours
friends
make
esther
changed
beauty
class
true
man
February
dear
girls
thing
taxi
job
find
wouldn
afraid
filipino
year
american
beauty
live
woman
movies
happened
shoes
family
makes
March
papa
don
mommy
asuna
men
americans
nature
realize
simply
told
voice
world
bus
skin
ha
ago
japanese
blood
diary
April
dear
diary
town
made
white
fun
dressed
learn
sun
hour
days
rest
week
blue
soldiers
navy
kids
straight
pretty
May
dear
girls
thing
taxi
job
find
wouldn
afraid
filipino
year
american
beauty
live
woman
movies
happened
shoes
family
makes
June
papa
don
mommy
asuna
men
americans
nature
realize
simply
told
voice
world
bus
skin
ha
ago
japanese
blood
diary
July
red
day
leave
dance
min
insular
top
idea
half
country
lose
realized
servicemen
lot
breeze
ahead
appearance
change
lie
August
betty
wahiawa
taxi
set
show
mr
wanted
party
mama
ve
wrong
insular
helped
played
dinner
food
chapman
fil
hawaiian
September
betty
wahiawa
taxi
set
show
mr
wanted
party
mama
ve
wrong
insular
helped
played
dinner
food
chapman
fil
hawaiian
October
johnny
rose
nice
supper
breakfast
tiquio
lunch
lydia
office
ll
raymond
theater
tonight
doesn
tomorrow
altar
kim
warm
forget
November
didn
left
papa
richard
long
met
told
house
back
felt
sat
gave
hand
don
sweet
called
meeting
dress
miss
December
ray
lydia
dorm
bus
lovely
couldn
caught
ramos
asked
kissed
park
waikiki
close
st
arm
loved
xmas
held
world

Note that some clusters appear twice. MALLET considers the directory of .txt files as its whole corpus, then spits out which clusters each file is most closely associated with.

As you can see, I should really have taken out ‘dear’ and ‘diary.’ But I can see that these clusters make sense. She begins the diary in mid-January. It’s her first diary ever, so she tends first toward the grandiose, talking about changes in technology and what it means to be American, and later begins to write about the people in her life, like Betty, her roommate, and Tiquio, the creepy taxi driver. In almost all of the clusters, the War shows up somehow. But what I was really looking forward to was seeing how her entries’ topics changed in December, when she began dating Ray, the man who would be my grandfather. Aww.

It’s a small text, in the grand scheme of things, clocking in at around 40,000 words. If you want to see what one historian did with MALLET and a diary kept for 27 years, Cameron Blevins has a very enthusiastic blog post peppered with very nice R visualizations.

Gentle SEO reminders

I know this dead horse has been beaten. But here are some reminders about things that slip through the cracks.

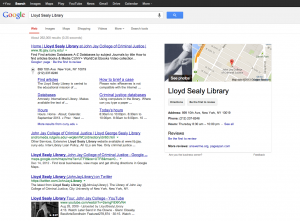
Every once in a while, google the name and alternate names of your organization and check the universal (not personal) results.

Google results page: before (Note: this is my best approximation. Was too distressed to take a screenshot)
I did this a while ago and was shocked to discover that the one image that showed up next to the results was of someone injecting heroin into their arm! Oh my god! As it turned out, one of our librarians had written a blog post about drug abuse research and that was a book cover or illustration or something. None of us knew about it because why would we google ourselves? Well, now we google ourselves.

Are you the business owner?Claim your location on Google+.

Click the “Are you the business owner?” link (pink in screenshot at right). You’ll have to verify before you can make a basic page. But in doing so, you will have some control over the photos that show up next to the place name. For example, I posted some of my better library photographs to our Google+ page, and they soon replaced the heroin arm.

Demote sitelinks as necessary.

Sitelinks are the sub-categories that show up beneath the top search result. In our case, it’s things like ‘Databases’ and ‘How to find books’ — appropriate for a library. But there were also some others, like ‘Useful internet links’ (circa 2003) that were no longer being updated, so once verified as webmasters, we demoted them.

Check out your reviews.

Since place-based search is the thing now, you’d better keep tabs on your Foursquare, Google, and other reviews pages. For one thing, it’s great to identify pain points in your user experience, since we are now trained to leave passive-aggressive complaints online rather than speak to humans. Example: our Foursquare page has a handful of grievances about staplers and people being loud. Okay, so no surprise there, but we’re trying to leave more positive tips as the place owners so that people see The library offers Library 101 workshops every fall when they check in, not Get off the damn phone! (verbatim).

Add to your front-page results.

If there are irrelevant or unsatisfactory search results when you look up your organization, remember that you have some form of control. Google loves sites like Wikipedia, Twitter, YouTube, etc., so establishing at least minimal presences on those sites can go far.

Meta tags.

Okay, so this is SEO 101. But I surprised myself this morning when I realized, oh dear, we don’t have a meta description. The text of our search result was our menu options. Turns out Drupal (and WordPress) don’t generate meta tags by default. You’ll have to stick them in there manually or install a module/plug-in. Also, you’ll want to use OpenGraph meta tags now. These will give social sites more info about what to display. They look like this:

<meta property="og:title" content="Lloyd Sealy Library at John Jay College of Criminal Justice"/>
<meta property="og:type" content="website"/>
<meta property="og:locale" content="en_US"/>
<meta property="og:site_name" content="Lloyd Sealy Library at John Jay College of Criminal Justice"/>
<meta property="og:description" content="The Lloyd Sealy Library is central to the educational mission of John Jay College of Criminal Justice. With over 500,000 holdings in social sciences, criminal justice, law, public administration, and related fields, the Library's extensive collection supports the research needs of students, faculty, and criminal justice agency personnel."/>

All right, good luck. Here’s hoping you don’t have photos of explicit drug use to combat in your SEO strategy.

P.S. If you use the CUNY commons, try the Yoast WordPress SEO plugin. It is really configurable, down the post-level.

What did I do this year?

180+ notes
180+ notes

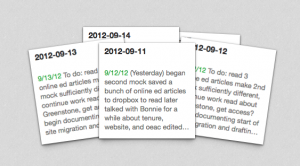
I’ve mentioned before that I keep a professional journal as a quick way to keep tabs on the projects I’m doing and what I should be focusing on. It takes the form of a 3-part note in Evernote: Done, To Do, and Backburner.

My annual evaluation is coming up, for which I have to write a self-evaluation summarizing all the things I did this year. It’s hard to slow down and think big-picture, and it’s hard to remember what exactly my priorities were last fall when I’m so caught up in what I’m doing now.

Output as HTML
Output as HTML

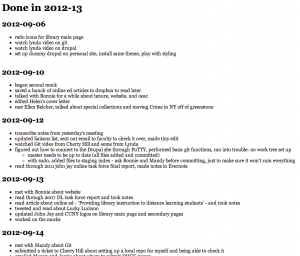
To get a jump-start, I wrote a tiny Python script to iterate through my notes (exported to HTML). Using BeautifulSoup to climb the trees of my messy and non-standardized notes, it lists out all the things I marked “Done” since September.

I fed the plain text into Voyant Tools, “a web-based reading and analysis environment for digital texts.” It’s probably more interesting and helpful if you use a larger text, but my 8,900-word text had analyses of interest too.

Word cloud using Cirrus in Voyant Tools
Word cloud using Cirrus in Voyant Tools. Stopwords: Taporware & names of colleagues

Some of these aren’t so surprising. Oh, really, I went to lots of meetings and sent lots of emails? But it’s also easy to see that my priorities for most of the year centered on building the new library website (usability, git, drupal, database) with some side projects thrown in (signs, guides, newsletter, IA).

Here are the word frequency data from Voyant for words occurring more than 25 times (stop words included):

Words in the Entire Corpus. Corpus Term Frequencies provides an ordered list for all the terms’ frequencies appearing in a corpus. As well additional columns can be toggled to show other statistical information, including a small line graph for term frequency across the corpus.

Voyant Tools, Stéfan Sinclair & Geoffrey Rockwell (©2013) Privacy v. 3.0 beta (4583)

word count z-score mean
to 286 23.51 321.1
and 241 19.77 270.6
with 205 16.77 230.2
for 178 14.52 199.9
about 155 12.60 174.0
on 131 10.60 147.1
the 96 7.69 107.8
in 92 7.36 103.3
up 81 6.44 90.9
of 79 6.27 88.7
bonnie 72 5.69 80.8
meeting 59 4.61 66.2
sent 59 4.61 66.2
a 54 4.19 60.6
page 53 4.11 59.5
new 47 3.61 52.8
talked 47 3.61 52.8
email 43 3.27 48.3
emailed 43 3.27 48.3
mandy 43 3.27 48.3
ref 41 3.11 46.0
desk 40 3.02 44.9
all 38 2.86 42.7
blog 36 2.69 40.4
out 36 2.69 40.4
at 35 2.61 39.3
will 35 2.61 39.3
made 34 2.53 38.2
site 34 2.53 38.2
library 32 2.36 35.9
from 31 2.28 34.8
met 31 2.28 34.8
it 30 2.19 33.7
usability 30 2.19 33.7
be 29 2.11 32.6
signs 29 2.11 32.6
1 28 2.03 31.4
is 28 2.03 31.4
marta 28 2.03 31.4
post 28 2.03 31.4
database 27 1.94 30.3
faculty 27 1.94 30.3
more 27 1.94 30.3
not 27 1.94 30.3
test 27 1.94 30.3
2 26 1.86 29.2
added 25 1.78 28.1
asked 25 1.78 28.1
drupal 25 1.78 28.1
fixed 25 1.78 28.1

.

Word counts aren’t the whole story, obvs, but it’s a good place to start for my self-evaluation!

Python + BeautifulSoup + Twitter + Raspberry Pi

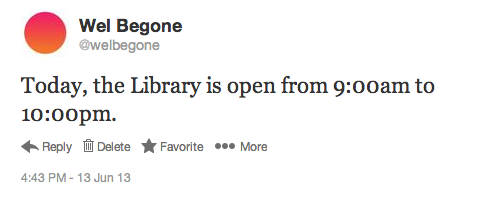
In my ongoing experiments with my Raspberry Pi, I’ve been looking for small ways it can be useful for the library. I’ve been controlling my Pi remotely using SSH in Terminal (tutorial — though you’ll have to note your Pi’s IP address first). As I noted yesterday, I’ve been making it tweet, but was looking to have it share information more interesting than a temperature or light reading. So now I have the Pi tweeting our library’s hours on my test account:

Tweeting library hours

To do this, I installed BeautifulSoup, a Python library for working with HTML. My Python script uses BeautifulSoup to search the library’s homepage and find two spans with the classes date-display-start and date-display-end. (This is looking specifically at a view in Drupal that displays our daily hours.) Then it grabs the content of those spans and plunks it into a string to tweet. Here’s the script:

#!/usr/bin/env python
import tweepy
from bs4 import BeautifulSoup
import urllib3

CONSUMER_KEY = '********************' #You'll have to make an application for your Twitter account
CONSUMER_SECRET = '********************' #Configure your app to have read-write access and sign in capability
ACCESS_KEY = '********************'
ACCESS_SECRET = '********************'

auth = tweepy.OAuthHandler(CONSUMER_KEY, CONSUMER_SECRET)
auth.set_access_token(ACCESS_KEY, ACCESS_SECRET)
api = tweepy.API(auth)

http = urllib3.PoolManager()

web_page = http.request('GET','http://www.lib.jjay.cuny.edu/')
web_page_data = web_page.data

soup = BeautifulSoup(web_page_data)
openh = soup.find('span','date-display-start') #spans as defined in Drupal view
closedh = soup.find('span','date-display-end')
other = soup.find('span','date-display-single')

if openh: #if library is open today, tweet and print hours
openh = openh.get_text() + ' to '
closedh = closedh.get_text()
api.update_status("Today's Library hours: " + openh + closedh + '.')
print "Today's Library hours: " + openh + closedh + '.'
elif other: #if other message (eg Closed), tweet and print
other = other.get_text()
api.update_status("Today's Library hours: " + other + '.')
print "Today's Library hours: " + other + '.'
else:
print "I don't know what to do."

Python libraries used:

I’ve configured cron to post at 8am every morning:

sudo crontab -e
[I added this line:]
00 8 * * * python /home/pi/Projects/Twitter/libhours-johnjaylibrary.py

Notes: I looked at setting up an RSS feed based on the Drupal view, since web scraping is clunky, but no dice. Also, there’s no real reason why automated tweeting has to be done on the Pi rather than a regular ol’ computer, other than I’d rather not have my iMac on all the time. And it’s fun.