It’s self-evaluation time again! It’s the second year I’ve had to do this for my current job. Last year, I found it enormously helpful to quantify and visualize the activities I’d done in the given time period. I use the daily “Done today” entries I write in Evernote, a Python script I wrote last year, the BeautifulSoup Python library, and Voyant Tools to get a holistic look at what I did this year.
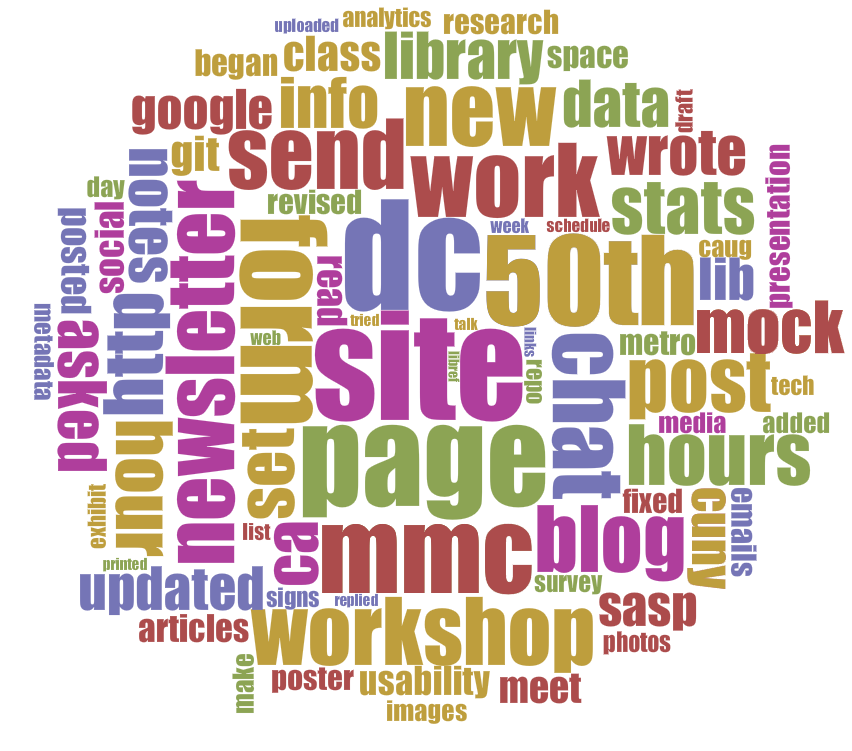
Voyant Tools allow different views of the data. One is Cirrus word clouds. (When used in combo with other data tools, word clouds are useful.) The image at the top of this entry is the word cloud that ignores common stop words, my colleagues’ names, and the words ref, desk, email/s/ed, met, meeting, talked,hr (hour), and sent.
Here’s the word cloud that only ignores common stop words:
We use EZproxy to provide off-campus users with access to subscription resources that require a campus-specific login. Every time a user visits an EZproxy-linked page (mostly by clicking on a link in our list of databaes), that activity is logged. The logs are broken up monthly as either complete (~1 GB for us) or abridged (~10 MB). The complete logs look something like this:
EZproxy log snippet example — click to enlarge
The complete logs log almost everything, including all the JavaScript and favicons loaded onto the page the user signs into. Hence why they are a gig large. The abridged logs have the same format as the illustration above, but keep only the starting point URLs (SPUs) and are much easier to handle. (Note that your configuration of EZproxy may differ from mine — see OCLC’s log format guide.)
We can get pretty good usage stats from the individual database vendors, but with monthly logs like these, why not analyze them yourself? You could do this in Excel, but Python is much more flexible, and much faster, and also, I’ve already written the script for you. It very hackily analyzes on- vs. off-campus vs. in-library use, as well as student vs. faculty use.
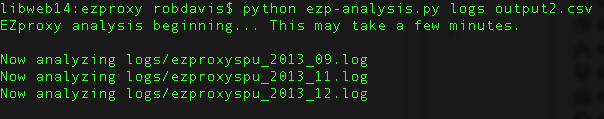
Use it on the command line like so: python ezp-analysis.py [directory to analyze] [desired output filename.csv]
Run it over the SPU logs, as that’ll take much less time and will give you a more useful connection count — that is, it will only count the “starting point URL” connections, rather than every single connection (javascript, .asp, favicon, etc.), which may not tell you much.
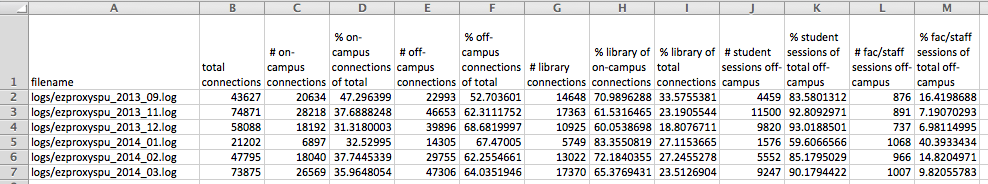
The script will spit out a CSV that looks like this:
With which you can then do as you please.
Caveats
“Sessions” are different from “connections.” Sessions are when someone logs into EZproxy and does several things; a connection is a single HTTP request. Sessions can only be tracked if they’re off-campus, as they rely on a session ID. On-campus EZproxy use doesn’t get a session ID and so can only be tracked with connections, which are less useful. On-campus use doesn’t tell us anything about student vs. faculty use, for instance.
Make sure to change the IP address specifications within the script. As it is, it counts “on campus” as IP addresses beginning with “10.” and in-library as beginning with “10.11.” or “10.12.”
This is a pretty hacky script. I make no guarantees as to the accuracy of this script. Go over it with a fine-toothed comb and make sure your output lines up with what you see in your other data sources.
Please take a good look at the logs you’re analyzing and familiarize yourself with them — otherwise you may get the wrong idea about the script’s output!
Things you could add to the script: analysis of SPUs; time/date patterns; …
Preliminary findings at John Jay
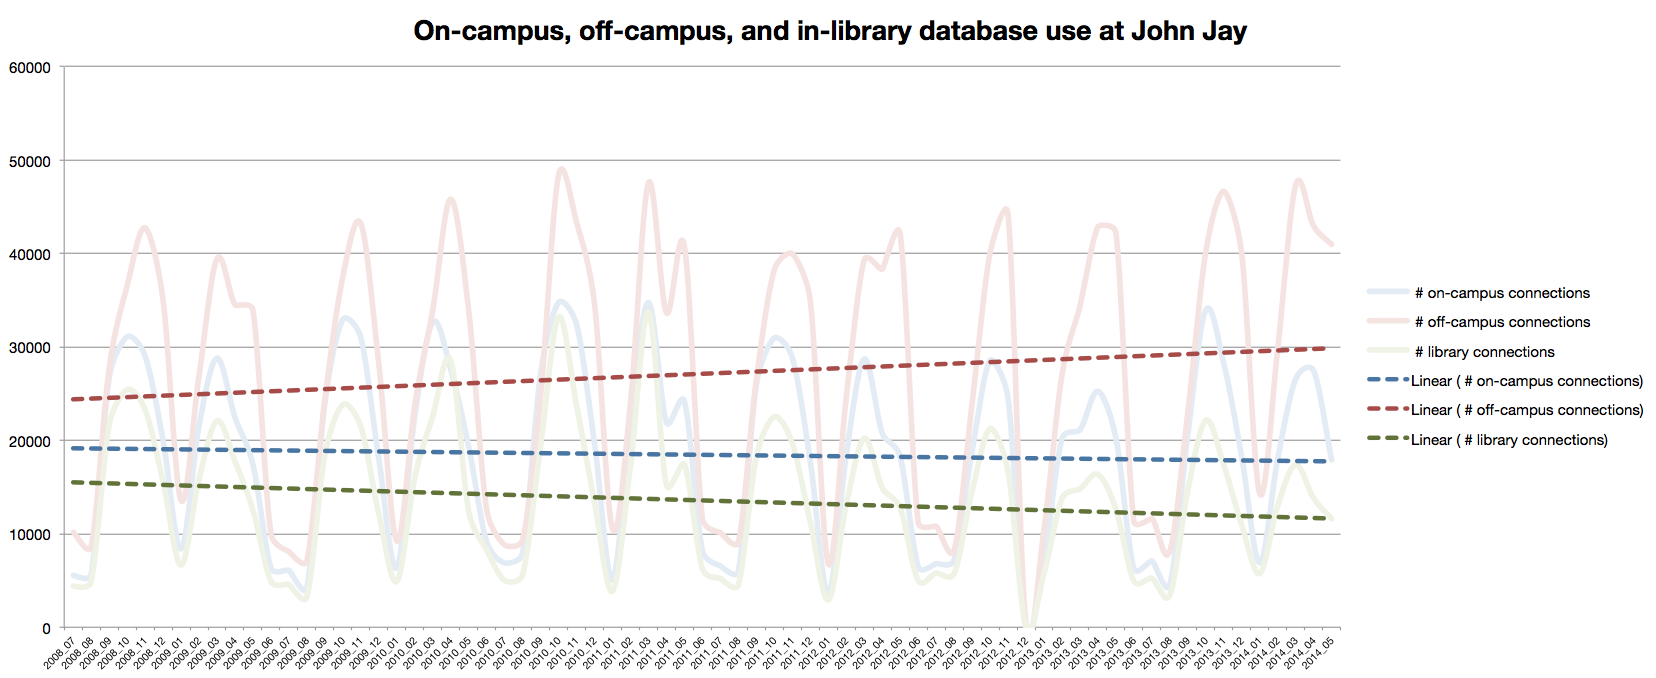
Here’s one output of the data I made, with the counts of on-campus, off-campus, and in-library connections pegged by month from July 2008 to preset, overlaid with lines of best fit:
Click for larger
Off-campus connection increase: Between 2008 and 2014, database use off-campus saw an increase of ballpark 20%. Meanwhile, on-campus use has stayed mostly the same, and library use has dropped by ballpark 15%, although I think I must not be including a big enough IP range, since we’ve seen higher gate counts since 2008. Hm.
Variance: As you can see by the squigglies in the wild ups and downs of the pale lines above, library resource use via EZproxy varies widely month to month. Extreme troughs are obviously when school is not in session. Compared to January, we usually get over 3x the use of library resources in November. The data follows the flow of the school year.
Students vs. faculty: When school is in session, EZproxy use is 90% students and 10% faculty. When school is not in session, those percentages pretty much flip around. (Graph not shown, but it’s boring.) By the numbers, students do almost no research when class is not in session. Faculty are constantly doing research, sometimes doing more when class is not in session.
Data issues: The log for December 2012 is blank. Boo. Throws off some analyses.
If you have suggestions or questions about the script, please do leave a comment!
The library where I work and play, Lloyd Sealy Library at John Jay College of Criminal Justice, has had the privilege to have 130+ items scanned and put online by the Internet Archive (thanks METRO! thanks marketing dept at John Jay!). These range from John Jay yearbooks to Alger Hiss trial documents to my favorites, the NYPD Annual Reports (great images and early data viz).
For each scanned book, IA generates master and derivative JPEG2000 files, a PDF, Kindle/Epub/Daisy ebooks, OCR’d text, GIFs, and a DjVu document (see example file list). IA does a great job scanning and letting us do QA, but because they load the content en masse to the internet, there’s no real reason to give us hard copies or a disk drive full of the files. But we do want them, because we want offline access to these digital derivatives of items we own.
The Programming Historian published another fantastic post this month: Data Mining the Internet Archive Collection. In it, Caleb McDaniel walks us through the internetarchive Python library and how to explore and download items in a collection.
I adapted some of his example Python scripts to download all 133 items in John Jay’s IA collection at once, without having to write lots of code myself or visit each page. Awesome! I’ve posted the code to my Github (sorry in advance for having a ‘miscellaneous’ folder, I know that is very bad) and copied it below.
Note that:
it will take HOURS to download all items, like an hour each, since the files (especially the master JP2s) can be quite large, plus IA probably controls download requests to avoid overloading their servers.
before running, you’ll need to sudo pip install internetarchive in Terminal (if using a Mac) or do whatever is the equivalent with Windows for the internetarchive Python library.
your files will download into their own folders, under the IA identifier, wherever you save this .py file
## downloads all items in a given Internet Archive collection
## See http://programminghistorian.org/lessons/data-mining-the-internet-archive for more detailed info
import internetarchive as ia
coll = ia.Search('collection:xxxxxxxx') #fill this in -- searches for the ID of a collection in IA
## example of collection page: https://archive.org/details/johnjaycollegeofcriminaljustice
## the collection ID for that page is johnjaycollegeofcriminaljustice
## you can tell a page is a collection if it has a 'Spotlight Item' on the left
num = 0
for result in coll.results(): #for all items in a collection
num = num + 1 #item count
itemid = result['identifier']
print 'Downloading: #' + str(num) + '\t' + itemid
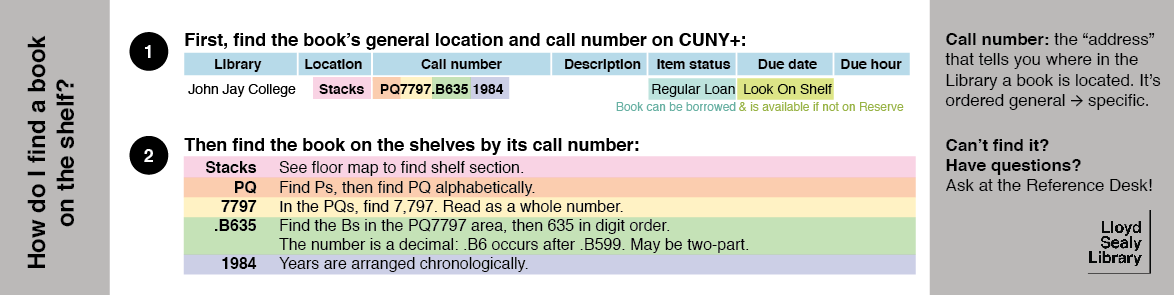
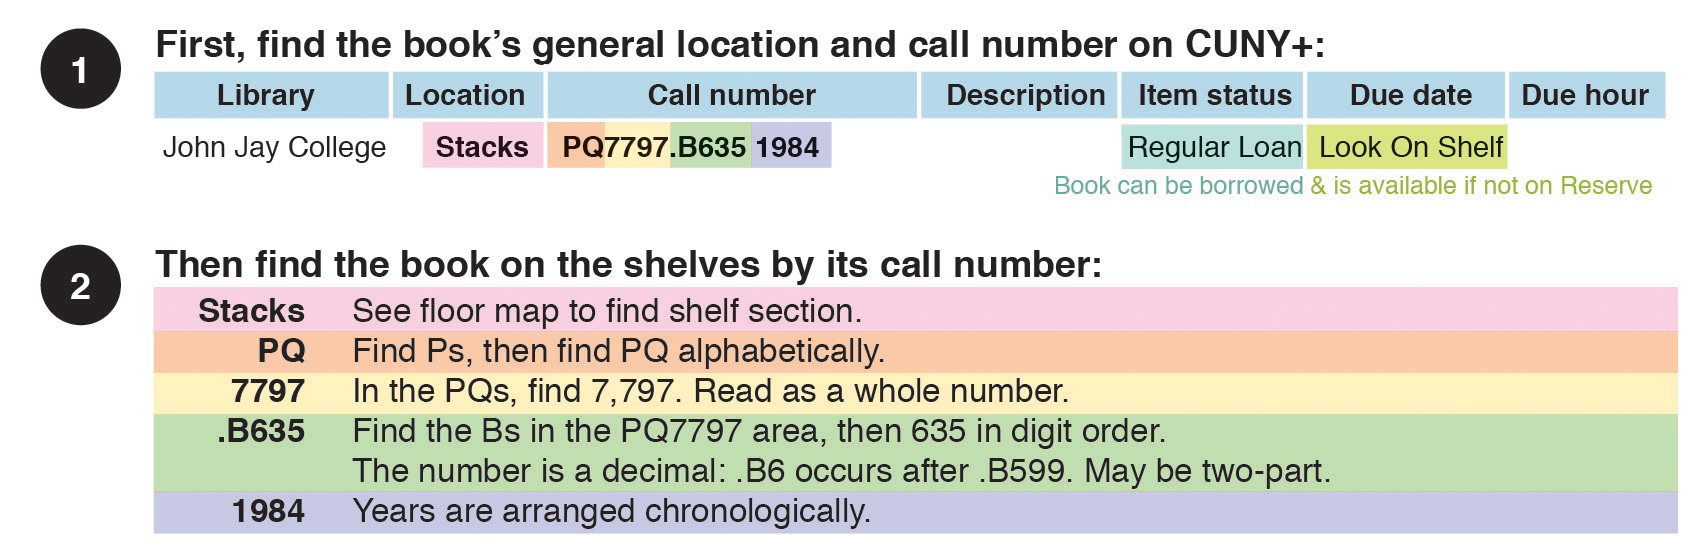
I’ve designed a bookmark for my library to help undergrads find books by call number. It’s a complex concept, so a handheld guide is useful. Our main use case is explaining call numbers to students at the Reference Desk using this bookmark as a visual aid. Our stacks include floor maps and (soon) posters explaining call numbers in a more visual way.
If you’d like to modify the bookmark for your institution, here’s the template for Adobe InDesign. This template is free to use and modify without attribution by anybody in the universe (CC0). Requires Adobe InDesign and the Helvetica font. I’d appreciate any feedback or suggestions!
Or if you just want to grab the graphic and you have some editing software, here’s a 300ppi PNG (click for full image):
The bookmark is somewhat CUNY-specific — in step one, I’ve made a mock of how a book record looks like in our catalog, CUNY+. The template helpfully points out what to change when modifying it for your library.
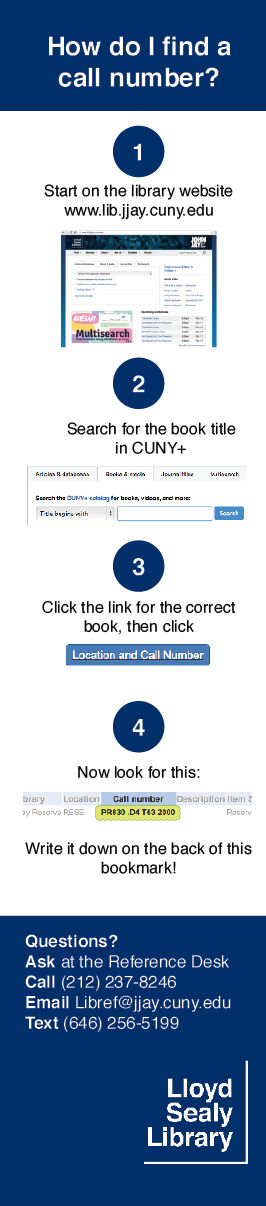
And! It’s a two-fer! You also get the How do I find a call number? bookmark to the left, which is very CUNY-specific but might be a good template to follow. (You’ll get a “missing links” error for the screenshots in this one.)
If you don’t have InDesign, you can grab the text of the bookmark below.
How do I find a book on the shelf?
Step 1. First, find the book’s general location and call number in the catalog. Example:
Library
Location
Call number
Item type
Item status
John Jay College
Stacks
PQ7797.B635 1984
Regular loan (book can be borrowed)
Look on shelf (book is available)
Step 2. Then find the book on the shelves by its call number.
Stacks
See floor map to find shelf section.
PQ
Find Ps, then find PQ alphabetically.
7797
In the PQs, find 7,797. Read as a whole number.
.B635
Find the Bs in the PQ7797 area, then 635 in digit order. The number is a decimal: .B6 occurs after .B599. May be two-part.
1984
Years are arranged chronologically.
Call number: the “address” that tells you where in the Library a book is located. It’s ordered general → specific.
Can’t find it? Have questions? Ask at the Reference Desk!
Email us at [email protected] so we can respond to your questions and requests. Please email from your CUNY email address if possible. Or visit our help site for more information: